BLOG

Communicating Science

Future of East Rongbuk Glacier

Posted by William Colgan on May 13, 2024
Climate Change, Communicating Science, New Research / No Comments

We have a new study out that looks at the fate of East Rongbuk Glacier under the current range of IPCC Shared Socioeconomic Pathways (SSPs). East Rongbuk Glacier is located on the north slope of Mount Everest, also called Chomolungma, where the climate is very cold and dry. The relatively little snowfall at East Rongbuk Glacier makes it sensitive to small increases in surface melt associated with climate change. Many different glaciological observations, including surface mass balance, ice thickness and ice temperature, have been collected at East Rongbuk Glacier by different teams working at the site over many years. This makes it a relatively data rich glacier site within high mountain Asia.

Figure 1 – East Rongbuk Glacier outlined on the north slope of Mount Everest (Chomolungma). Colors depict ice surface velocities overlaid on a satellite image of the Himalayas. Red dots denote boreholes.

In this study, we simulate East Rongbuk Glacier with an ice flow model. The surface forcing of the ice flow model is the magnitude and spatial distribution of accumulation and ablation, as well as surface temperatures. We use climate data from ten different CIMP6 ensemble members as surface forcing. The model then simulates the thickness, temperature and velocity of the glacier that fits with this surface forcing. Once we ensure that the model simulates the present-day glacier thickness, temperature and velocity, as well as recently observed ice loss, we apply the SSP-126 (low emissions), SSP-370 (middle of the road) and SSP-585 (high emissions) climate projections of the CIMP6 ensemble. The model then simulates the changing form and flow of the glacier under these future scenarios.

Although we use ten CMIP6 climate forcings, we generally focus on the pattern revealed by the ensemble mean, rather than any one particular CMIP6 climate projection. We find that under the SSP-126 scenario, East Rongbuk Glacier will likely experience maximum, or peak, meltwater runoff around 2030. About 55% of the glacier volume will remain at the end of this century. Under the SSP-370 and SSP-585 scenarios, the peak water will likely occur around 2060. Under these scenarios, less than 30% of the glacier volume will remain at the end of this century. While glacier volume less per year is decreasing by the end of the century under SSP-126, it is still decreasing quite rapidly under SSP-370 and SSP-585. This suggests that adopting SSP-126 would have a significant impact on stabilizing the volume of East Rongbuk Glacier. This may be characteristic of broadly similar glaciers in high mountain Asia.

Figure 2 – Normalized cumulative volume and area changes of East Rongbuk Glacier during 2010–2100 under three IPCC climate scenarios (SSP-126, SSP-370, and SSP-585). Dotted color lines represent the ten individual CMIP6 ensemble members, while the thick black line represents ensemble mean.

We do a variety of simulations to test the sensitivity of these projections against assumptions of the model. These sensitivity simulations highlight the importance of including ice dynamics, which change glacier geometry, when projecting meltwater runoff decades into the future. Many projections of glacier runoff in high mountain Asia do not yet include changes in ice geometry over time. While important, however, the impact of incorporating ice dynamics into glacier projections is still limited in comparison to the choice of climate forcing. Individual members of the CMIP6 climate forcing ensemble can yield very different projections. For example, a “high sensitivity” CMIP6 member suggests that East Rongbuk Glacier may disappear completely by the end of the century under SSP370, while a “low sensitivity” CMIP6 member suggests that 40% of the glacier may remain at the end of the century under SSP585. This highlights the substantial uncertainty in our present understanding of the fate of East Rongbuk Glacier.

Zhang, T., Wang, Y., Leng, W., Zhao, H., Colgan, W., Wang, C., Ding, M., Sun, W., Yang, W., Li, X., Ren, J., and Xiao, C. 2024. Projections of Peak Water Timing From the East Rongbuk Glacier, Mt. Everest, Using a Higher-Order Ice Flow Model. Earth’s Future. 12, e2024EF004545. https://doi.org/10.1029/2024EF004545

Tags: , , , , , , , ,

Geothermal Influence on Basal Ice Temperatures

Posted by William Colgan on January 28, 2024
Climate Change, Communicating Science, New Research / No Comments

We have a new open-access study out in the current volume of The Cryosphere that looks at geothermal heat flow beneath the Greenland Ice Sheet. Geothermal heat flow is an important boundary condition for ice flow models because it influences the temperature of the ice-bed interface, which in turn influences how easily ice can deform and flow. Right now, there are about seven widely used estimates of geothermal heat flow beneath the Greenland Ice Sheet (Figure 1). These different heat flow maps come from different research groups, using different methods. It hasn’t been entirely clear what the influence of choice of heat flow map has on modeled ice flow. For example, the ensemble of Greenland ice flow projections within the Ice-Sheet Model Inter-comparison Project for CMIP6 (ISMIP6) used differing heat flow maps. Our new study simply spins up a Greenland ice flow model with all seven heat flow maps and tries to understand the resulting differences in ice thickness and velocity.

Figure 1 – The differences in the magnitude and spatial distribution of geothermal heat flow, relative to ensemble mean, in the seven Greenland geothermal heat flow maps we assessed in this study.

Although the average geothermal heat flow only varies by about ±10 mW/m2 across the seven heat flow maps, there are pronounced variations in the spatial distributions of this heat flow. This means that there can be local heat flow differences of up to ±100 mW/m2 between individual heat flow maps. When the ice sheet model is spun up in a fully transient mode with these different heat flow maps, there are lots of areas where the difference in ice thickness from ensemble mean exceeds ±150 meters (Figure 2). This is due to spatial differences in basal ice temperatures, which strongly influence the viscosity and deformation of ice. Across the seven transient spin ups, the discharge of icebergs into the ocean varies by about ±10 gigatonnes per year, which is equivalent to about ±2.5% of the total ice-sheet iceberg discharge.

Figure 2 – The differences in ice thickness after a fully transient 10,000 year spin up, relative to ensemble mean, associated with the seven Greenland geothermal heat flow maps we assessed in this study.

We also spun up the ice flow model with the seven different heat flow maps under a so-called “nudged” spin up that was a key part of ISMIP6. Unlike a fully transient spin up, a “nudged” spin up constrains modeled ice thicknesses with observed ice thicknesses; it generally ensures a very realistic geometry for the simulated ice sheet. Although the ice geometry is more-or-less constant across these “nudged” simulations, there are still pronounced differences in the magnitude and spatial distribution of ice velocity. This largely results from large differences in the extents of the frozen and thawed ice-bed areas. Depending on choice of heat flow map, between 22 and 54% of the ice-bed area is simulated as thawed (Figure 3). This has strong implications for the proportion of the ice sheet beneath which water-dependent processes, like basal sliding, can occur.

Figure 3 – The differences in temperature at the ice-bed interface after a nudged ISMIP6-style spin up, relative to pressure melting point, associated with the seven Greenland geothermal heat flow maps we assessed in this study.

So, what is the way forward after showing that the choice of heat flow map has a non-trivial impact on Greenland ice sheet simulations? Well, deciding which heat flow map is “the best” is one approach. We highlight a small, but growing, database of in situ temperature measurements against which simulated ice temperatures can be compared. There are also qualitative hints as to which heat flow map might be most appropriate. For example, does it preserve the widespread frozen basal conditions that we find in North Greenland? In terms of community ice-sheet projections, we recommend that it may be prudent to limit the direct inter-comparison of ice-sheet simulations to those using a common heat-flow map. In terms of ISMIP specifically, we suggest that future ensemble should perhaps use a range of basal geothermal forcing scenarios, similar to how it employs a range climate forcing scenarios.

Zhang, T., Colgan, W., Wansing, A., Løkkegaard, A., Leguy, G., Lipscomb, W. H., and Xiao, C.: Evaluating different geothermal heat-flow maps as basal boundary conditions during spin-up of the Greenland ice sheet, The Cryosphere, 18, 387–402, https://doi.org/10.5194/tc-18-387-2024, 2024.

Tags: , , , , , , , , , ,

Bedrock Uplift from Greenland’s Peripheral Glaciers

Posted by William Colgan on January 16, 2024
Climate Change, Communicating Science, New Research / No Comments

We have a new article in the current issue of Geophysical Research Letters that looks at the influence of Greenland’s peripheral glaciers on vertical bedrock motion. Greenland’s bedrock is currently uplifting, due to both slow mantle-deformation processes associated with ice loss at the end of the Last Glacial Period, and fast elastic processes associated with ice loss today. The vertical bedrock uplift being measured in Greenland today ranges from a couple millimeters to a couple centimeters across the country. Understanding the magnitude and spatial distribution of this uplift helps us understand not only recent ice loss, but also properties of the Earth’s mantle beneath Greenland.

Figure 1 – Time series of the observed vertical land motion (VLM) at Mestersvig (MSVG) station in East Greenland. The elastic rebound associated with the Greenland Ice Sheet (GrIS), Greenland Peripheral Glaciers (GrPG) and Canadian Peripheral Glaciers (CanPG) are calculated. The post-Last Glacial Period glacioisostatic adjustment (U_GIA) is then calculated as a residual.

When folks create maps of Greenland’s present-day uplift rate, they typically use a model of changing ice-sheet geometry through time, to incorporate the effect of changing ice load on the Earth’s crust. This captures the main signal, but it ignores the cumulative effect of Greenland’s thousands of peripheral glaciers. These glaciers, which surround the ice sheet, also effect vertical bedrock motion. In this study, we also incorporate the effect of changing peripheral glacier geometry through time into uplift rates calculated at all the GNET bedrock motion sites around Greenland. In the figure above, you can see the vertical land motion budget of MSVG (Mestersvig) GNET station, which calculates post-Last Glacial Period glacioisostatic adjustment (GIA) as the residual of present-day elastic rebound.

Figure 2 – Comparison between post-Last Glacial Period glacioisostatic adjustment (GIA) that we calculate across the 58 GNET stations, compared to four widely used maps of Greenland GIA. A mismatch between the station color and the map color highlights a discrepancy between the previously calculated GIA and the GIA calculated in this study. These four previous studies used different methods, but all ignored the elastic rebound associated with peripheral glaciers.

We find that peripheral glaciers can have a disproportionately large impact on the elastic rebound of GNET sites, especially when they are located relatively far from the ice sheet. In some regions, especially in Greenland’s north and northeast, peripheral glaciers can contribute to over 20% of the total elastic response of regional GNET sites. Simply put, mapping Greenland’s present-day uplift rate with models that only incorporate the ice sheet, and not peripheral glaciers, can really underestimate the elastic rebound associated with present-day ice loss. Under estimating present-day elastic rebound can result in subsequently over estimating the post-Last Glacial Period glacioisostatic adjustment that is used to infer mantle properties.

So, perhaps the main message of this study is that although Greenland’s peripheral glaciers are quite small in comparison to the ice sheet, their recent collective ice loss can influence our understanding of Greenland’s vertical land motion in a disproportionately large way!

Open-Access Study: Berg, D., Barletta, V. R., Hassan, J., Lippert, E. Y. H., Colgan, W., Bevis, M., et al. (2024). Vertical land motion due to present-day ice loss from Greenland’s and Canada’s peripheral glaciers. Geophysical Research Letters, 51, e2023GL104851. https://doi.org/10.1029/2023GL104851

Tags: , , , , , , ,

‘Cold Content’ of Greenland’s Firn Plateau

Posted by William Colgan on April 29, 2020
Climate Change, Communicating Science, New Research / Comments Off on ‘Cold Content’ of Greenland’s Firn Plateau

We have a new open-access study in the current issue of Journal of Glaciology that investigates the “cold content” of Greenland’s high-elevation firn plateau1. Firn is the relatively low density near-surface ice-sheet layer comprised of snow being compressed into ice. Cold content is one of its quirkier properties. Of course, all firn is literally freezing – meaning below 0°C – but some firn is colder than other firn. Clearly, it takes a lot more energy to warm -30°C firn to 0°C, than it does for -1°C firn. Our study highlights at least one discernible shift in cold content – how much sensible heat energy is required to warm firn to the 0°C melting point – in response to climate change.

Figure 1 – The nine high-elevation ice-sheet sites where we assessed firn cold content in the top 20 m.

There is a strong annual cycle in firn cold content. Generally, cold content is at its maximum each April, after the firn has been cooled by winter air temperatures. Cold content then decreases through summer, as warming air temperatures and meltwater percolation pump energy into the firn, to reach a minimum each September. The magnitude of this annual cycle varies across the ice sheet, primarily as a function of the meltwater production, but also as a function of snowfall-dependent firn density. Firn density is highly sensitive to snowfall rate, and firn cold content is a function of firn density.

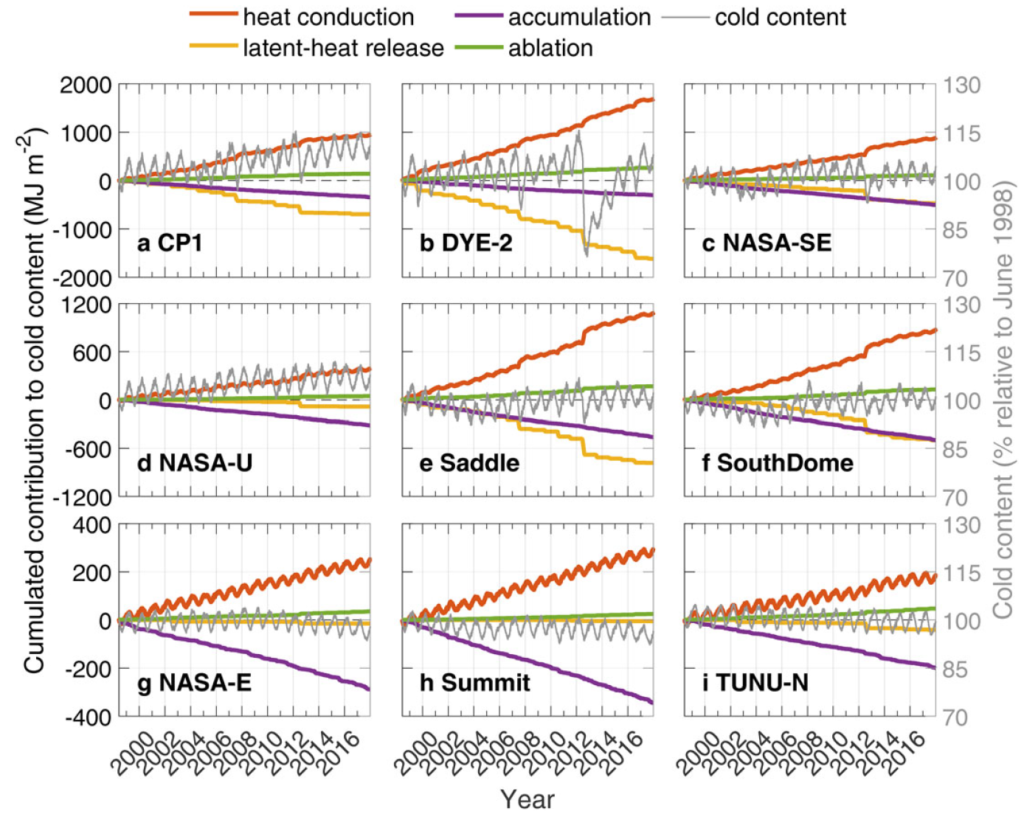
Figure 2 – The mean annual cycle in four-component firn cold content assessed at the nine ice-sheet sites over the 1988-2017 period. Note the relatively large latent heat release associated with meltwater at Dye-2, in comparison to other sites.

We find few discernible year-on-year trends in cold content across the highest elevation areas of the firn plateau. For example, there is perhaps a slight decrease at Summit – where we find snowfall is increasing at 24 mm/decade and air temperatures are warming at 0.29°C/decade – but statistically-significant multi-annual trends in cold content are difficult to separate from year-to-year variability. At Dye-2, however, which has the greatest melt rate of the sites that we examine, there is clear evidence of the impact of changing climate. At Dye-2, an exceptional 1-month melt event in 2012 removed ~24% of the cold content in the top 20 m of firn. It took five years for cold content to recover to the pre-2012 level.

Figure 3 – The cumulative four-component firn cold content at the nine ice-sheet sites over the 1998-2017 period. Note the sharp loss of Dye-2 cold content in 2012, and the subsequent multi-year recovery of this cold content.

The refreezing of meltwater within firn is a potential buffer against the contribution of ice-sheet melt to sea-level rise; surface melt can refreeze within porous firn instead of running off into the ocean. But refreezing meltwater requires available firn cold content. The multi-annual reset of cold content that we document at Dye-2 suggests that a single melt event can reduce firn cold content – and thus precondition firn for potentially less meltwater refreezing – for years to follow. This highlights the potential for the cold content of Greenland’s firn plateau to decrease in a non-linear fashion, as climate change pushes melt events to progressively higher elevations of the firn plateau.

1Vandecrux, B., R. Fausto, D. van As, W. Colgan, P. Langen, K. Haubner, T. Ingeman-Nielsen, A. Heilig, C. Stevens, M. MacFerrin, M. Niwano, K. Steffen and J. Box. 2020. Firn cold content evolution at nine sites on the Greenland ice sheet between 1998 and 2017. Journal of Glaciology..

Tags: , , , , , , , , , ,

Changes in Ice-Sheet Density: How and Why?

Posted by William Colgan on October 25, 2018
Climate Change, Communicating Science, New Research, Sea Level Rise / Comments Off on Changes in Ice-Sheet Density: How and Why?

We investigate the high-elevation firn plateau of the Greenland Ice Sheet in a new open-access study in the current issue of Journal of Geophysical Research1. This study pulls together singularly unique – and hard fought – ice core observations and weather station data into a super-neat firn model. This relatively porous near-surface ice-sheet layer known as firn is being increasingly scrutinized for two main reasons.

The first reason is sea-level rise. These high regions of the Greenland ice sheet are normally preserved form intense melting, but this is changing, with more melt seen in recent years. Nevertheless, the porosity of the firn can provide a buffer against sea-level rise when meltwater refreezes within the firn instead of running off into the ocean. But exactly how much of this buffering capacity is available – and for how long – is not really understood.

The second reason is satellite altimetry. Repeat observation of ice thickness by satellite altimeter is a primary method by which ice-sheet mass balance – or overall health – is assessed. But since firn is porous, changes in elevation don’t always translate into changes in mass. For example, the firn layer can become thinner – making the ice-sheet appear thinner – when there’s actually just an increase in firn density rather than a change in mass.

Figure 1 – Locations of the four study sites on the Greenland Ice Sheet’s high-elevation firn plateau.

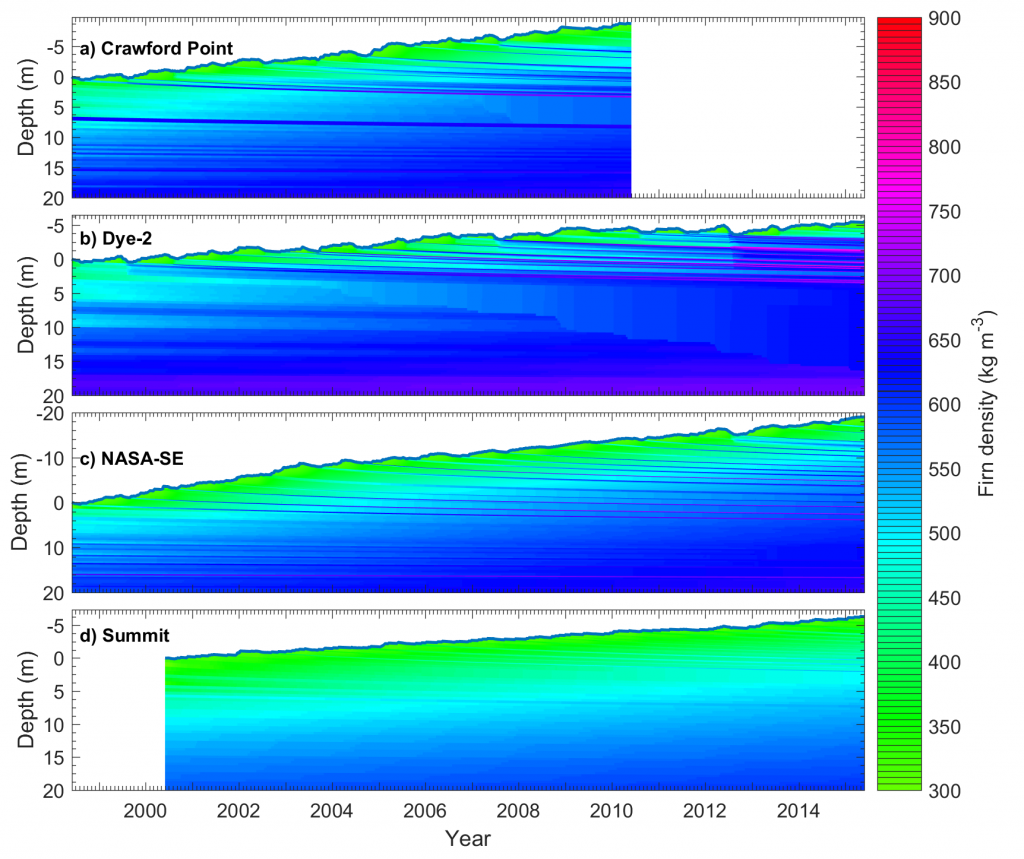
In this study, we were interested in teasing out the climatic controls of firn density: What makes firn porosity grow and shrink over time? So, we simulated the evolution of firn density – and therefore porosity – over time at four ice-sheet sites. These sites were carefully chosen as sites where both in-situ climate and firn measurements were available (Crawford Point, Dye-2, NASA-SE and Summit). The firn simulations used an updated version of the HIRHAM regional climate model’s firn model. At each site, we initiated simulations using firn density profiles observed from ice cores, and then ran the simulations forward in time using in-situ weather station records. We then ensured that simulated firn density also compared well with repeat firn density profiles observed again many years later. The simulations were between 11 and 15 years, depending on the data available at each site.

Figure 2 – Simulated firn density through time at the four study sites. At all sites, the relative depth of a given layer increases over time, as snowfall exceeds meltwater runoff.

A lot of recent ice-sheet research has focused on how increasing air temperatures and meltwater production are increasing firn density. And our simulations definitely confirmed that! But perhaps counterintuitively, we found that the leading driver of changes in firn density was actually year-to-year changes in amount of snowfall. Firn density decreases as snowfall increases, and vice versa. This study therefore highlights that if we want to project time-and-space variability in firn density we really need to project time-and-space variability in snowfall rates.

Figure 3 – Assessing the relative strength of four drivers of firn density change at the four study sites.

It was also satisfying to see that – given observed climate data – our simulations could reproduce the firn conditions as observed in the field. This gives confidence including this firn model in regional climate models. This finding is of course limited to the high-elevation firn plateau of the Greenland Ice Sheet, which admittedly does not experience tremendous melt. But, as the firn plateau covers over 80% of the ice-sheet area, understanding it plays a key role in tackling pressing satellite altimetry and sea-level buffering questions.

This work is part of the Retain project funded by the Danmarks Frie Forskningsfond (grant 4002-00234). The open-access publication is available via the hyperlink below.

1Vandecrux, B., R. Fausto, P. Langen, D. van As, M. MacFerrin, W. Colgan, T. Ingeman‐Nielsen, K. Steffen, N. Jensen, M. Møller and J. Box. 2018. Drivers of firn density on the Greenland ice sheet revealed by weather station observations and modeling. Journal of Geophysical Research: Earth Surface. 123: 10.1029/2017JF004597.

Tags: , , , , , , , ,

Firn Permeability: New Use of an Old Technique

Posted by William Colgan on March 06, 2017
Communicating Science, New Research / Comments Off on Firn Permeability: New Use of an Old Technique

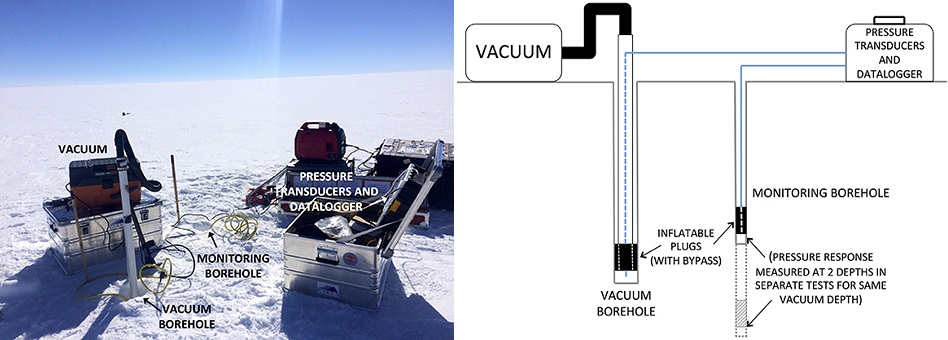
We have a new study out this month in Frontiers in Earth Science1 that describes using an old-school hydrogeology method on the Greenland Ice Sheet. We used pump-testing, which has been conventionally used to measure soil permeability for groundwater flow, to infer the permeability of ice-sheet firn to meltwater flow. We wanted to quantitatively measure how massive ice layers formed by refreezing meltwater in the near-surface ice sheet firn could inhibit meltwater flow in subsequent years.

firn3

Figure 1 – The low tech and low cost pump-testing device used to infer firn permeability on the Greenland Ice Sheet. A vacuum is applied at depth in the sealed vacuum borehole and the resulting pressure response is measured in the sealed monitoring borehole.

In conventional pump-testing, water is pumped out of a borehole at a controlled rate, and the groundwater level response, or drawdown is observed in a monitoring borehole located some distance away. We did something similar in the ice-sheet firn, pumping air out of a vacuum borehole and measuring the air pressure response is a sealed monitoring borehole about one meter away. We did pump tests at six ice sheet sites that had varying degrees of massive ice layers in the near-surface firn.

We found that vertical permeability between firn layers was generally much lower than horizontal permeability within a firn layer, and that vertical permeability decreased with increasing ice content. At the lowest elevation site, where meltwater production and refreezing is most prevalent, we drilled into an exceptionally massive ice layer the pump borehole was able to maintain an effective vacuum. In other words, thick massive ice layers are indeed impermeable to fluids. That was a little surprising!

firn_permeability

Figure 2 – Inferred horizontal (kr) and vertical (kz) firn permeability values at five ice-sheet sites. Horizontal blue lines indicate the depths of ice layers at each site. Vertical cyan and magenta shading represents inferred permeability limits.

While it may sound esoteric, the permeability of near-surface firn is an increasingly visible topic in ice-sheet research. Studies have shown that firn can act to either buffer sea level rise by absorbing meltwater2, or enhance sea level rise by forming impermeable refrozen ice layers3. As climate change increases meltwater production within the historical accumulation zone of the ice sheet, a greater area of ice-sheet hydrology will be influenced by refrozen ice layers. In future, higher vacuum pressures and repeated measurements should allow firn permeability to be measured over larger scales to improve our understanding of changing firn permeability.

For now, the proof-of-concept pump-testing device is relatively low tech and low cost. Aside from air-pressure sensors and a data logger, it was constructed by items you could find at your local hardware store; plastic PVC pipes channeling the power of a shop vacuum. Development of the firn pump-testing device was initiated by a University of Colorado Dean’s Graduate Student Research Grant to highly innovative lead-author Aleah Sommers, and it was deployed in collaboration with the FirnCover project during the 2016 field campaign.

WP_20160502_004

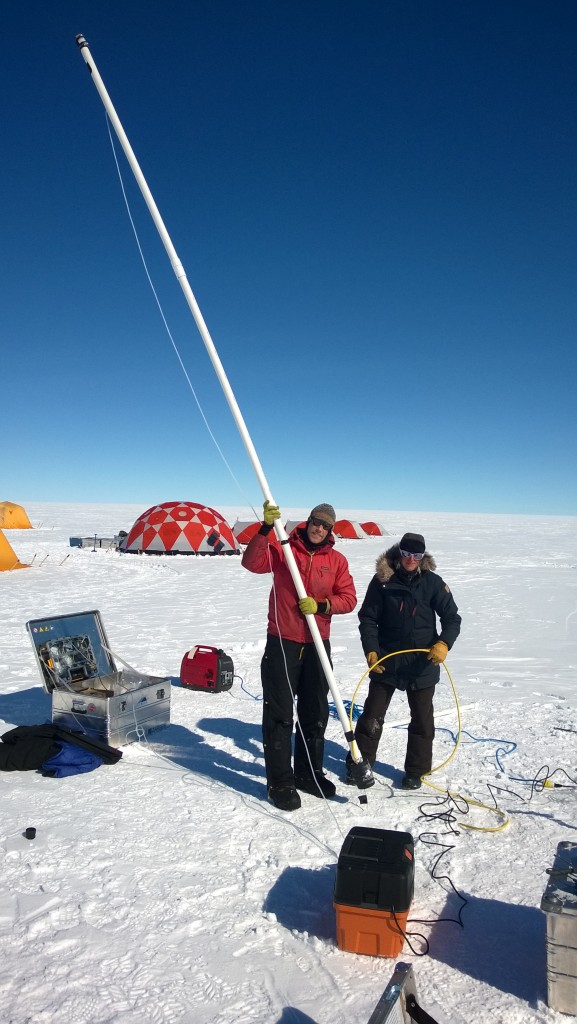
Figure 3 – Max Stevens and Aleah Sommers preparing to insert the pressure sensor and seal into the monitoring borehole at Saddle, Greenland, in May 2016.

1Sommers et al. 2017. Inferring Firn Permeability from Pneumatic Testing: A Case Study on the Greenland Ice Sheet. Frontiers in Earth Science. 5: 20.

2Harper et al. 2012. Greenland ice-sheet contribution to sea-level rise buffered by meltwater storage in firn. Nature. 491: 240-243.

3Machguth et al. 2016. Greenland meltwater storage in firn limited by near-surface ice formation. Nature Climate Change. 6: 390-393.

Tags: , , , , , , ,

Canadian Military Support for Arctic Science?

Posted by William Colgan on April 14, 2016
Commentary, Communicating Science, Glaciers and Society / 1 Comment

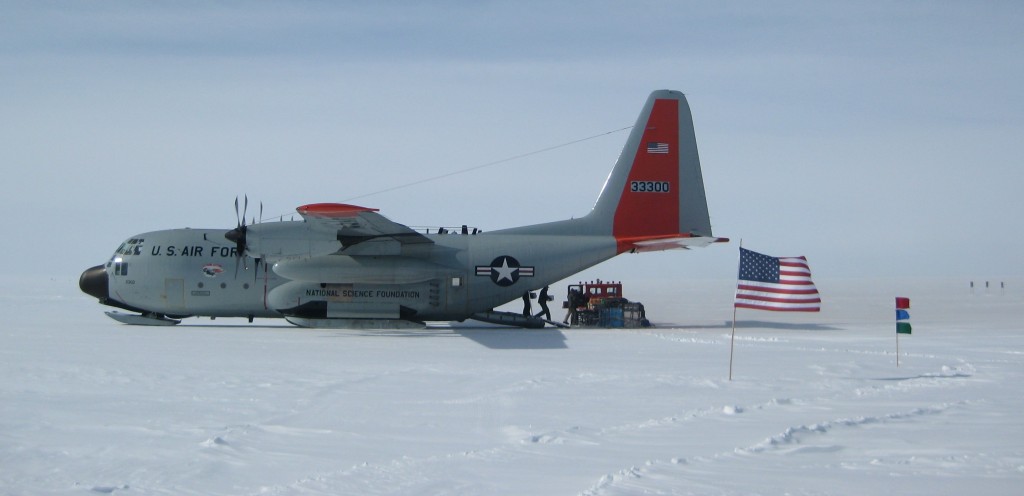
I wish Canada would seriously consider developing a stronger civilian-military partnership in the areas of Arctic science and defense. The highly efficient partnership between the US National Science Foundation (NSF) and the US Air National Guard (ANG) in Greenland provides an impressive example.

IMG_6514

A US Air National Guard ski-equipped C-130, here dropping off researchers and equipment at Dye-2 on the Greenland Ice Sheet, costs approximately CAD 9000 per flight hour.

The 109th ANG wing essentially transports scientists and their equipment from the continental US to research bases in Greenland, and sometimes even on to the ice sheet, in return for full-cost payment from the NSF. The NSF-ANG full-cost special airlift arrangement (SAAM) delivers one C-130 transport plane flight hour for about CAD 9000.

In Canada, by comparison, High Arctic researchers generally travel to the main Polar Continental Shelf Project (PCSP) research base in Resolute, Nunavut, via commercial flights. A single Ottawa to Resolute round-trip ticket is about CAD 4000. But this ticket only comes with a 32 kg baggage allowance, and researchers are generally heavy packers. With checked bag penalties reaching almost CAD 200, it is easy to spend another CAD 1000 on baggage over above ticket price. Often, there is also an institutional overhead of about 40% on commercial purchases, meaning funding agencies ultimately pay close to CAD 7000 to get a single Canadian researcher and their equipment to Resolute; not far off a C-130 flight hour.

Flights to Resolute might seem like an esoteric topic, but Canada sends a lot of researchers there. The PCSP supports approximately 850 field researchers each year. That means at least CAD 3.4M in the direct cost of commercial air tickets, or closer to CAD 6.0M when indirect (overhead and baggage) costs are factored in. The NSF-ANG partnership seems to suggest that Canada could be getting more bang for these bucks. For example, while commercially flying ten researchers and equipment roundtrip between Ottawa and Resolute is about CAD 70K (incl. indirect costs), the ANG can fly more than twice that payload on the same route for about 81K. The ANG can even land that payload “open field” far from any airport.

025 Apr 23, 6 35 31 AM

Researchers and equipment in a US Air National Guard C-130, en route to the Greenland Ice Sheet Dye-2 ski-way, during the Arctic Circle Traverse 2013 (ACT13) campaign.

Adopting a civilian-military partnership for Canadian Arctic research would clearly improve the return on expenditure for Canadian research agencies, while also providing an almost zero-cost mechanism for increased military presence in the Canadian Arctic, which translates into enhanced standby transport or search-and-rescue capacity. The NSF-ANG partnership also shows that in addition to producing tangible benefits, “soft” benefits associated with direct, widespread, and meaningful interaction between military and civilian personnel can be cultivated.

So, I am delighted to hear that the Canadian military is learning how to build ski-ways on which ANG C-130s can land. For an Arctic researcher like myself, the next ideal step would be getting skis on a Canadian C-130 (technically converting it into an LC-130), and then getting research agencies to pay the military to fly that ski-equipped C-130 to some useful field sites throughout the Canadian High Arctic!

Tags: , , , , , , , ,

New Book: Iluliaq – Isbjerge – Icebergs

Posted by William Colgan on September 22, 2015
Climate Change, Communicating Science, Glaciers and Society / Comments Off on New Book: Iluliaq – Isbjerge – Icebergs

I was very pleased to have the opportunity to write a preface for Iluliaq – Isbjerge – Icebergs, which contains 100+ pages of watercolours and photographs depicting diverse icebergs around Greenland, along with accompanying Danish/English narration about the iceberg lifecycle (ISBN 978-87-93366-34-3 | available here). I am very supportive of projects like this, which seek to bridge the arts-sciences chasm. It was actually science-editing the iceberg factoids in this book that compelled me to start providing mass loss rates in equivalent tonnes per second in my subsequent publications. I now find saying that Greenland is losing 262 gigatonnes of ice per year, is more abstract than saying it is losing 8300 tonnes per second. Evidently, my perspective was shifted by this delightful project! Below I provide the preface in full.

iluliaq

Preface for Iluliaq – Isbjerge – Icebergs:

“While an individual iceberg is ephemeral, icebergs are a ubiquitous feature of Greenland’s landscape. The shifting nature of icebergs, a constantly drifting and capsizing population, makes them challenging to observe. As they are partway through the transition from glacier ice into ocean water, icebergs are somewhat peripheral to both glaciology/geology and oceanography. Despite these intrinsic difficulties in their study, however, icebergs have never been more important to society than today. Due to climate change, Greenland’s glaciers are now flowing faster than a century ago. The resulting increase in Greenland’s iceberg production is now raising global sea level by 2 cm each decade.

In contrast to the iconic climate change indicators of diminishing sea ice area and glacier volume, there are now more icebergs being produced than a century ago. This provides a very strong motivation to understand the iceberg lifecycle. This lifecycle begins with a thunderous calving at genesis, followed by years of slow drifting and reduction, and quietly ends when the last ice melts into water. In this book, Pernille Kløvedal Nørgaard, Martin von Bülow and Ole Søndergaard provide visually compelling insights on selected aspects of this lifecycle.

By ensuring they not only communicate the natural majesty, but also climatic importance, of Greenland’s icebergs, the authors are helping icebergs assume a rightful place in contemporary public consciousness. The sense of humility evoked by the icebergs depicted here will be familiar to Arctic enthusiasts. These photos and watercolours represent multiple expeditions and extensive travels around Greenland. Similar to documentarians and artists who have accompanied polar expeditions since the Victorian Era, the authors have intentionally sought out a harsh environment, and invited confrontation with adverse conditions, to encapsulate a unique feature of Earth that most people could otherwise never appreciate. Society benefits from such hardy souls, whose passion for nature allows bleak and inaccessible landscapes to be transmitted into our civilized homes.”

Tags: , , , , , ,

Vanishing Canada: Group of Seven Landscapes Under Climate Change

Posted by William Colgan on July 31, 2015
Climate Change, Communicating Science / 3 Comments

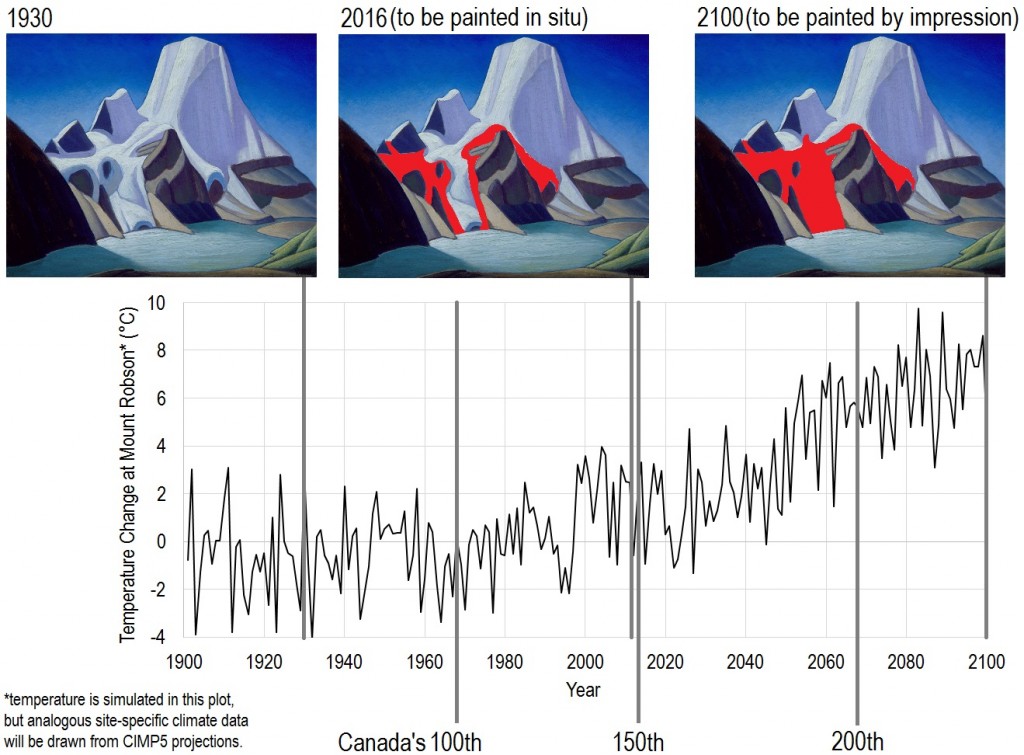
In collaboration with Virginia Eichhorn of the Tom Thomson Art Gallery, I am hoping to get a very interdisciplinary arts and sciences project underway that looks at the impact of recent and projected climate change on the Canadian landscapes painted by the Group of Seven. The exceptionally vivid expressionist landscape scenes painted by the Group of Seven between 1920 and 1935 have become Canadian cultural icons. The temperature and precipitation trends associated with climate change, however, are changing these landscapes, most visibly through changes in vegetation, snow and glacier extent, lake or sea ice extent, and flood or drought frequency (Figure 1). We intend to reframe Group of Seven paintings as unique time capsules of a vanishing Canada, rather than portraits of an intransient Canada.

Mount_Robson_mockup

Figure 1 – Highly visible landscape change at Mount Robson due to air temperature change. Red shading denotes glacier area change since Lawren Harris originally painted this scene c. 1930.

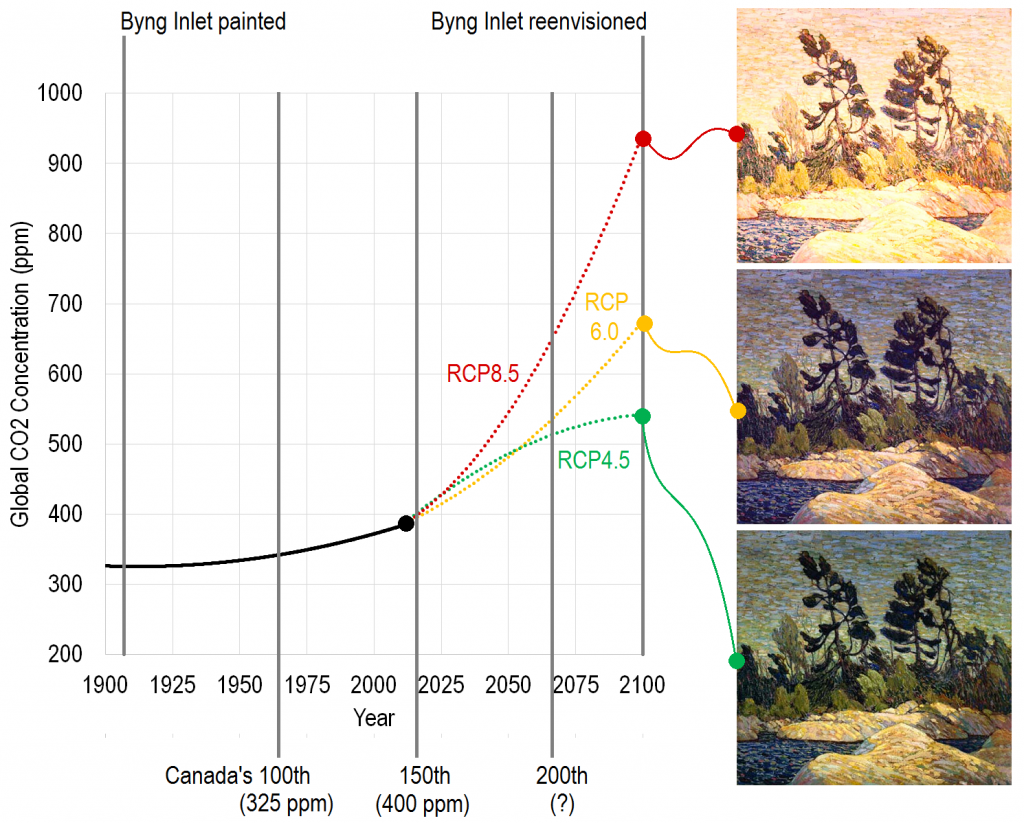
To do this, we are seeking to dispatch contemporary emerging artists across Canada, to landscapes featured in Group of Seven works, to re-paint impressions of these landscapes under one of three IPCC Representative Concentration Pathways (RCPs). These RCPS, ranging from RCP 4.5 to RCP 8.5, essentially range from “optimistic” to “pessimistic” CO2emissions reductions scenarios. For example, RCP 4.5 simulates 4.5 W/m2 increased radiative forcing in year 2100 relative to year 1850, while RCP 8.5 simulates 8.5 W/m2, or almost twice as much, anomalous radiative forcing associated with well-mixed greenhouse gases from anthropogenic sources.

Mock_up2

Figure 2 – Envisioning a landscape in 2100 under three IPCC scenarios that vary from the “optimism” of RCP 4.5 to the “pessimism” of RCP 8.5. Byng Inlet was originally painted by Tom Thomson c. 1920.

We are ultimately aiming for a cross-disciplinary arts and sciences exhibition that will place specific Group of Seven landscapes, and more broadly Canada’s landscape, in the context of ongoing climate change in a highly visual fashion. Inspired by ArtTracks150, we are hoping that Canada’s 150th birthday (July 2017) may provide a natural window of increased public awareness of centurial time-scales, during which we might briefly focus public attention on the multi-generational implications of climate change on the Canadian landscape. Virginia and I welcome you to contact us for more information on, and ways to get involved with, this project.

Tags: , , , , ,

Hybrid Gravimetry and Altimetry Mass Balance

Posted by William Colgan on July 07, 2015
Communicating Science, New Research, Sea Level Rise / Comments Off on Hybrid Gravimetry and Altimetry Mass Balance

We have a new study in this month’s Remote Sensing of Environment, which examines satellite-derived glacier mass balance in Greenland and the Canadian Arctic1. Satellites are generally used to assess glacier mass balance through changes in volume (via satellite altimetry) or changes in mass (via satellite gravimetry). While satellite altimetry observes volume changes at relatively high spatial resolution, it necessitates the forward modeling of firn processes to convert volume changes into mass changes. Conversely, the cryosphere-attributed mass changes observed by satellite gravimetry, while very accurate in absolute terms, have relatively low spatial resolution. In this study, we sought to combine the complementary strengths of both approaches. Using an iterative inversion process that was essentially sequential guess-and-check with a supercomputer, we refined gravimetry-derived observations of cryosphere-attributed mass changes to the relatively high spatial resolution of altimetry-derived volume changes. This gave us a 26 km spatial resolution mass balance field across Greenland and the Canadian Arctic that was simultaneously consistent with: (1) glacier and ice-sheet extent derived from optical imagery, (2) cryospheric-attributed mass trends derived from gravimetry, and (3) ice surface elevation changes derived from altimetry. We have made digital versions of this product available in the supplementary material associated with the publication.

Figure_1

Figure 1 – Observational data inputs to our inversion algorithm. A: Cryosphere-attributed mass changes observed by gravimetry. B: Land ice extent observed by optical imagery. C: Ice surface elevation changes observed by altimetry.

To make sure our inferred mass balance field was reasonable, we evaluated it against all in situ point mass balance observations we could find. Statistically, the validation was great, yielding an RMSE of 15 cm/a between the inversion product and in situ measurements. Practically, however, this apparent agreement largely stems from the fact that we could only find forty in situ point mass balance observations against which to compare. Evaluating our area-aggregated sector-scale mass balance estimates against all previously published sector-scale estimates provides a more meaningful validation. This suggests the magnitude and spatial distribution of inferred mass balance is reasonable, but highlights that the community needs more in situ point observations of mass balance, especially from peripheral glaciers and regions of high dynamic drawdown in Greenland. (For the glaciology hardcores I will note that “mass balance” is distinct from “surface mass balance”, in that the former measurement also includes the ice dynamic portion of mass change.)

Figure_11_corrected

Figure 2 – A comparison of similar sector scale mass balance estimates and associated uncertainties across Greenland and the Canadian Arctic. Dashed lines denote estimates that pertain to the Greenland ice sheet proper (i.e. exclusive of peripheral glaciers). Jacob et al. (2012) estimates pertain to Canada, while Sasgen et al. (2012) estimates pertain to Greenland.

This new inversion mass balance product, which we are calling “HIGA” (Hybrid glacier Inventory, Gravimetry and Altimetry), suggests that between 2003 to 2009 Greenland lost 292 ± 78 Gt/yr of ice and the Canadian Arctic lost  42 ± 11 Gt/yr of ice. While the majority of Greenland’s ice loss was associated with the ice sheet proper (212 ± 67 Gt/yr), peripheral glaciers and ice caps, which comprise < 5 % of Greenland’s ice-covered area, produced ~ 15 % of Greenland mass loss (38 ± 11 Gt/yr). A good reminder that ice loss from “Greenland” is not synonymous with ice loss from the “Greenland ice sheet”. Differencing our tri-constrained mass balance product from a simulated surface mass balance field allowed us to assess the ice dynamic component of mass balance (technically termed the “horizontal divergence of ice flux”). This residual ice dynamic field infers flux divergence (or submergent ice flow) in the ice sheet accumulation area and at tidewater margins, and flux convergence (or emergent ice flow) in land-terminating ablation areas. This is consistent with continuum mechanics theory, and really highlights the difference in ice dynamics between the ice sheet’s east and west margins.

Figure_13

Figure 3 – Spatially partitioning the glacier continuity equation in surface and ice dynamic components. A: Transient glacier and ice sheet mass balance. B: Simulated surface mass balance. C: Residual ice dynamic (or horizontal divergence of ice flux) term. The ∇Q color scale is reversed to maintain blue shading for mass gain and red shading for mass loss in all subplots. Color scales saturate at minimum and maximum values. Black contours denote zero.

As with some scientific publications, this one has a bit of a backstory. In this case, we submitted a preliminary version of the study to The Cryosphere in December 2013. After undergoing three rounds of review at The Cryosphere, the first one of which is archived in perpetuity here, it was rejected, primarily for insufficient treatment of the uncertainty associated with firn compaction. Coincidentally, on the same day I received The Cryosphere rejection letter, I received a letter from the European Space Agency (ESA) granting funding for a follow-up study. A mixed day on email indeed! After substantial retooling, including a discussion section dedicated to firn compaction and the most conservative error bounds conceivable, we were happy to see this GRACE-ICESat study funded by NASA and the Danish Council for Independent Research appear in Remote Sensing of Environment. The editors at both journals, however, were very helpful in moving us forward. Our ESA-funded GRACE-CryoSat product development is now ongoing, but a sneak peek is below.

ESA_partition

Figure 4 – Same as Figure 3, except using a 5 km resolution GRACE-CryoSat inversion product instead of a 26 km resolution GRACE-ICESat inversion product. Colorbars are different in shading, but identical in magnitude.

Reference

1W. Colgan, W. Abdalati, M. Citterio, B. Csatho, X. Fettweis, S. Luthcke, G. Moholdt, S. Simonsen, M. Stober. 2015. Hybrid glacier Inventory, Gravimetry and Altimetry (HIGA) mass balance product for Greenland and the Canadian Arctic. Remote Sensing of Environment. 168: 24-39.

Tags: , , , , , ,