We have a new study in this month’s Remote Sensing of Environment, which examines satellite-derived glacier mass balance in Greenland and the Canadian Arctic1. Satellites are generally used to assess glacier mass balance through changes in volume (via satellite altimetry) or changes in mass (via satellite gravimetry). While satellite altimetry observes volume changes at relatively high spatial resolution, it necessitates the forward modeling of firn processes to convert volume changes into mass changes. Conversely, the cryosphere-attributed mass changes observed by satellite gravimetry, while very accurate in absolute terms, have relatively low spatial resolution. In this study, we sought to combine the complementary strengths of both approaches. Using an iterative inversion process that was essentially sequential guess-and-check with a supercomputer, we refined gravimetry-derived observations of cryosphere-attributed mass changes to the relatively high spatial resolution of altimetry-derived volume changes. This gave us a 26 km spatial resolution mass balance field across Greenland and the Canadian Arctic that was simultaneously consistent with: (1) glacier and ice-sheet extent derived from optical imagery, (2) cryospheric-attributed mass trends derived from gravimetry, and (3) ice surface elevation changes derived from altimetry. We have made digital versions of this product available in the supplementary material associated with the publication.

Figure 1 – Observational data inputs to our inversion algorithm. A: Cryosphere-attributed mass changes observed by gravimetry. B: Land ice extent observed by optical imagery. C: Ice surface elevation changes observed by altimetry.
To make sure our inferred mass balance field was reasonable, we evaluated it against all in situ point mass balance observations we could find. Statistically, the validation was great, yielding an RMSE of 15 cm/a between the inversion product and in situ measurements. Practically, however, this apparent agreement largely stems from the fact that we could only find forty in situ point mass balance observations against which to compare. Evaluating our area-aggregated sector-scale mass balance estimates against all previously published sector-scale estimates provides a more meaningful validation. This suggests the magnitude and spatial distribution of inferred mass balance is reasonable, but highlights that the community needs more in situ point observations of mass balance, especially from peripheral glaciers and regions of high dynamic drawdown in Greenland. (For the glaciology hardcores I will note that “mass balance” is distinct from “surface mass balance”, in that the former measurement also includes the ice dynamic portion of mass change.)

Figure 2 – A comparison of similar sector scale mass balance estimates and associated uncertainties across Greenland and the Canadian Arctic. Dashed lines denote estimates that pertain to the Greenland ice sheet proper (i.e. exclusive of peripheral glaciers). Jacob et al. (2012) estimates pertain to Canada, while Sasgen et al. (2012) estimates pertain to Greenland.
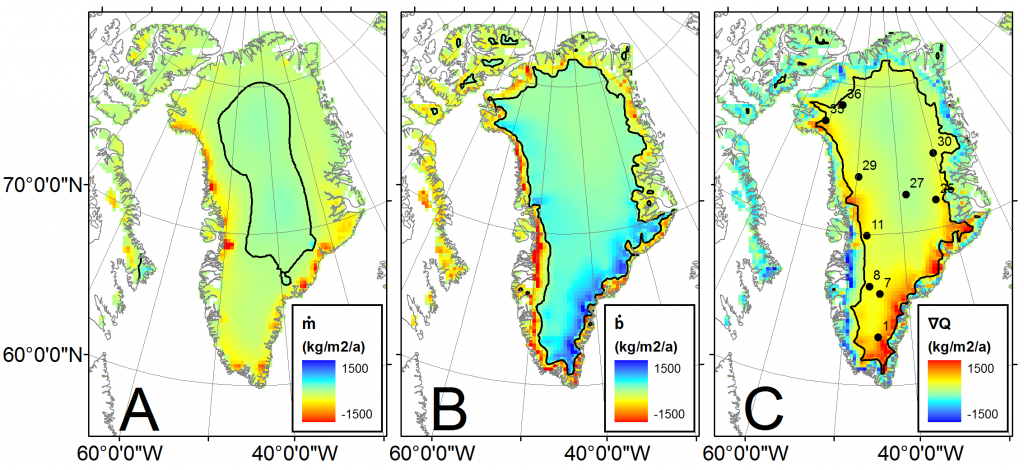
This new inversion mass balance product, which we are calling “HIGA” (Hybrid glacier Inventory, Gravimetry and Altimetry), suggests that between 2003 to 2009 Greenland lost 292 ± 78 Gt/yr of ice and the Canadian Arctic lost 42 ± 11 Gt/yr of ice. While the majority of Greenland’s ice loss was associated with the ice sheet proper (212 ± 67 Gt/yr), peripheral glaciers and ice caps, which comprise < 5 % of Greenland’s ice-covered area, produced ~ 15 % of Greenland mass loss (38 ± 11 Gt/yr). A good reminder that ice loss from “Greenland” is not synonymous with ice loss from the “Greenland ice sheet”. Differencing our tri-constrained mass balance product from a simulated surface mass balance field allowed us to assess the ice dynamic component of mass balance (technically termed the “horizontal divergence of ice flux”). This residual ice dynamic field infers flux divergence (or submergent ice flow) in the ice sheet accumulation area and at tidewater margins, and flux convergence (or emergent ice flow) in land-terminating ablation areas. This is consistent with continuum mechanics theory, and really highlights the difference in ice dynamics between the ice sheet’s east and west margins.

Figure 3 – Spatially partitioning the glacier continuity equation in surface and ice dynamic components. A: Transient glacier and ice sheet mass balance. B: Simulated surface mass balance. C: Residual ice dynamic (or horizontal divergence of ice flux) term. The ∇Q color scale is reversed to maintain blue shading for mass gain and red shading for mass loss in all subplots. Color scales saturate at minimum and maximum values. Black contours denote zero.
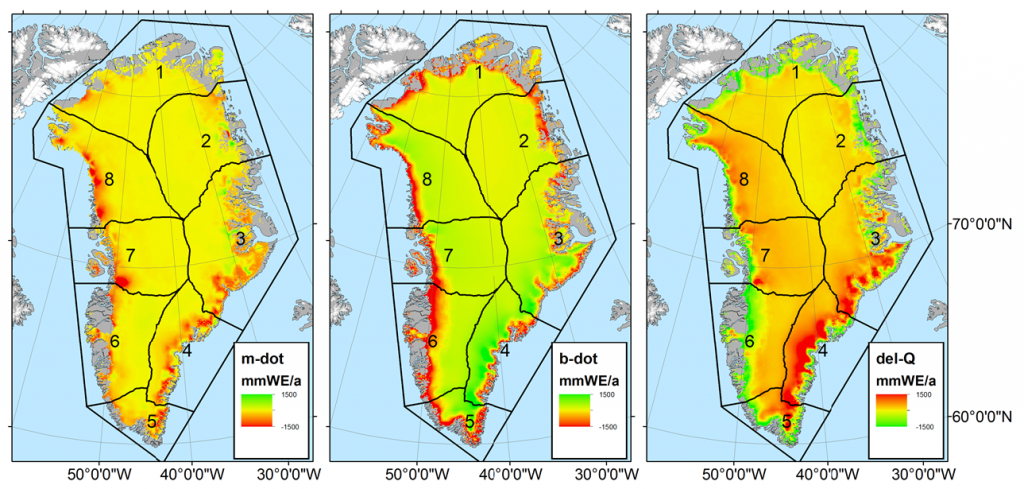
As with some scientific publications, this one has a bit of a backstory. In this case, we submitted a preliminary version of the study to The Cryosphere in December 2013. After undergoing three rounds of review at The Cryosphere, the first one of which is archived in perpetuity here, it was rejected, primarily for insufficient treatment of the uncertainty associated with firn compaction. Coincidentally, on the same day I received The Cryosphere rejection letter, I received a letter from the European Space Agency (ESA) granting funding for a follow-up study. A mixed day on email indeed! After substantial retooling, including a discussion section dedicated to firn compaction and the most conservative error bounds conceivable, we were happy to see this GRACE-ICESat study funded by NASA and the Danish Council for Independent Research appear in Remote Sensing of Environment. The editors at both journals, however, were very helpful in moving us forward. Our ESA-funded GRACE-CryoSat product development is now ongoing, but a sneak peek is below.

Figure 4 – Same as Figure 3, except using a 5 km resolution GRACE-CryoSat inversion product instead of a 26 km resolution GRACE-ICESat inversion product. Colorbars are different in shading, but identical in magnitude.
Reference
Our new #Greenland mass balance product assimilates satellite gravimetry and altimetry data: http://t.co/4FucwYzUGA pic.twitter.com/Kbekmq6uUU
— William Colgan (@GlacierBytes) July 7, 2015
