BLOG

Arctic

Five Decades of Arctic Change

Posted by William Colgan on April 08, 2019
Climate Change, New Research / Comments Off on Five Decades of Arctic Change

We have just completed a study that assesses indicators of Arctic change since 1971. It is available open-access in the current issue of Environmental Research Letters. We assimilate nine hyper-diverse data types – air temperature, permafrost temperature, precipitation, river discharge, tundra greenness, wildfire area, snowcover duration and, of course, sea ice area and land ice loss – into standardized indices. The motivation of this study is to bring together almost a five-decade time-series of biophysical variables into a common open-data framework.

Figure 1 – Three of the nine types of Arctic indicators compiled in this study over the 1971-2017 period. These three biophysical indicators show that Arctic tundra is becoming greener in response to increasing Arctic temperature and precipitation.

If there is one climate variable to rule them all, it is air temperature. Increasing air temperature leads to an intensification of the hydrologic cycle, which is clearly evident as increases precipitation and river discharge. Increasing temperature also drives increasing land ice loss and decreasing fall sea ice area. Beyond just the physical climate system, changing air temperature is also driving changes in the biological ecosystem. There is a startlingly clear – more than 99.9 % certain – correspondence between air temperature and the greenness of Arctic-wide tundra. This means a warmer Arctic is a greener Arctic.

In addition to assessing the nine types of indicators, we also discuss some of the tremendous number of knock-on effects of these biophysical trends. These knock-on, or biophysical cascade, effects include decreased alignment of flowering and pollinating windows for plant; increased prevalence of wildfire ignition conditions; an acceleration of the CO2 cycle with increased uptake during growing season counterbalanced by increased emissions in spring and fall; conversion between terrestrial and aquatic ecosystems; and shifting animal distribution and demographics. The Arctic biophysical system is now clearly trending away from its 20th Century state and into an unprecedented state, with biophysical implications not only within but beyond the Arctic.

This study was developed within the Arctic Monitoring and Assessment Program (AMAP), with the ambition that high-level Arctic summary statistics are of interest to the forthcoming IPCC Sixth Assessment Report (AR6). Annual time-series of the nine types of Arctic indicators compiled for this study will soon be freely available for download at www.amap.no. For now, you can access them via this GoogleSheet.

Box, J., W. Colgan, T. Christensen, N. Schmidt, M. Lund, F.-J. Parmentier, R. Brown, U. Bhatt, E. Euskirchen, V. Romanovsky, J. Walsh, J. Overland, M. Wang, R. Corell, W. Meier, B. Wouters, S. Mernild, J. Mård, J. Pawlak and M. Olsen. 2018. Key indicators of Arctic climate change: 1971–2017. Environmental Research Letters. 14: doi:10.1088/1748-9326/aafc1b.

Tags: , , , , ,

Eight trillion tonnes of Arctic ice lost since 1971

Posted by William Colgan on December 20, 2018
Climate Change, New Research, Sea Level Rise / 2 Comments

We have just completed a study that inventories Arctic land ice loss since 1971. It is available open-access in the current issue of Environmental Research Letters1. While we scientists have a pretty good idea of the health — or mass balance — of glaciers and ice sheets — or land ice — since the advent of satellite altimetry in the early 1990s, there is a need for better understanding of land ice health during the pre-satellite era. Our new study estimates the annual ice loss from all glacierized regions north of 55°N between 1971 and 2017.

We use in situ data – mass balance measurements from a handful of continuously monitored glaciers – as indicators for the health of land ice in seven Arctic regions. These hard-fought in situ data are scarce, they are only measured at between 20 and 44 Arctic glaciers every year. Extrapolating these data to entire regions is statistically challenging without additional information. Fortunately, independent estimates of regional mass balance are available from satellite gravimetry during the 2003 to 2015 period. This permits calibrating in situ and satellite-derived mass balance estimates during the satellite era. This makes our pre-satellite era estimates fairly robust.

During the 41 years assessed, we estimate that approximately 8,300 Gt of Arctic land ice was lost. It is difficult to contextualize this magnitude of ice loss. The flow of Niagara Falls – which is approximately 2400 m3 per second or about 75 km3 per year – is only equivalent to about half this volume (3500 km3) over the 1971-2017 period. The total Arctic land ice loss that we document represents 23 mm of sea-level rise since 1971. Greenland is by far the largest contributor (10.6 mm sea-level equivalent), followed by Alaska (5.7 mm sea-level equivalent) and then Arctic Canada (3.2 mm sea-level equivalent).

The UN Intergovernmental Panel on Climate Change (IPCC) now highlights two periods – the “recent past” (1986-2005) and “present day” (2005-2015) – as being of special interest in climate change studies. The Arctic land ice contribution to sea-level rise that we inventory increased from 0.4 to 1.1 mm sea-level equivalent between these periods. In terms of tonnes per second (5,000 to 14,000 t/s), both the magnitude – and the increase – are staggering.

Figure 1 – The cumulative sea-level rise contribution (in mm) from land ice in seven regions of the Arctic between 1971 and 2017. Analogous estimates from satellite gravimetry (GRACE) between 2003 and 2015 shown with open symbols.

The uncertainties associated with extrapolating sparse in situ data over large areas are undeniably large. But, the reality is that climate change was already gearing up as the global satellite observation network came online. So, in the absence of satellite data that can characterize the “pre-climate change” health of Arctic land ice, we need to leverage the extremely precious pre-satellite era observations that are available in creative ways. We hope that the ice loss estimates we present will be useful comparison targets for studies that estimate pre-satellite era mass balance in other ways.

The estimates of annual land ice mass balance — or health — in seven Arctic regions produced by this study are freely available for download here. This study was developed within the Arctic Monitoring and Assessment Program (AMAP) and International Arctic Science Committee (IASC) frameworks, as a direct contribution to the IPCC Special Report on the Ocean and Cryosphere in a Changing Climate (SROCC).

Figure 2 – Annual land ice mass balance — or health — in six Arctic regions between 1971 and 2017. Individual glacier mass balance records (blue lines) are combined into a regional composite (black line). Health is expressed both as a normalized score (left axis) and in gigatonnes per year (right axis). The numbers of glaciers comprising each composite is indicated in red text.

1Box, J., W. Colgan, B. Wouters, D. Burgess, S. O’Neel, L. Thomson and S. Mernild. 2018. Global sea-level contribution from Arctic land ice: 1971 to 2017. Environmental Research Letters.

Tags: , , , , , , ,

Canadian Military Support for Arctic Science?

Posted by William Colgan on April 14, 2016
Commentary, Communicating Science, Glaciers and Society / 1 Comment

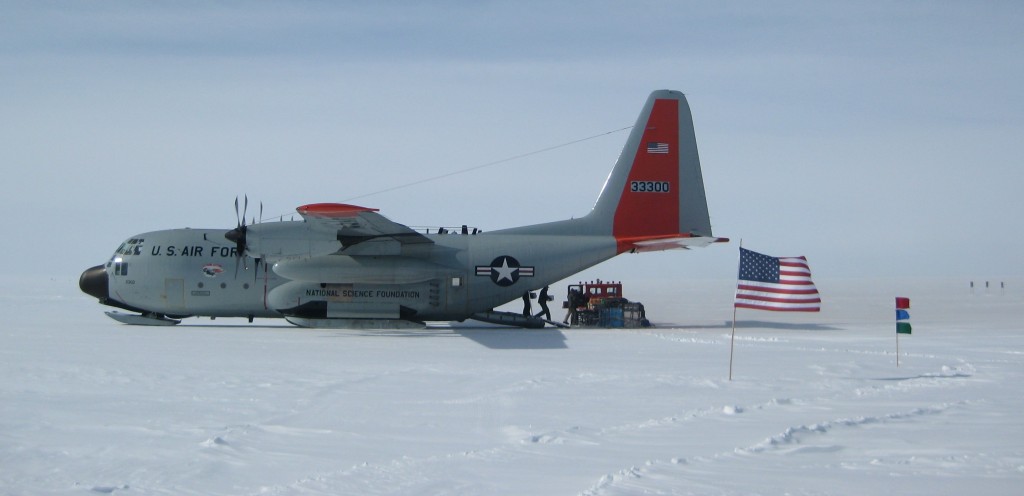
I wish Canada would seriously consider developing a stronger civilian-military partnership in the areas of Arctic science and defense. The highly efficient partnership between the US National Science Foundation (NSF) and the US Air National Guard (ANG) in Greenland provides an impressive example.

IMG_6514

A US Air National Guard ski-equipped C-130, here dropping off researchers and equipment at Dye-2 on the Greenland Ice Sheet, costs approximately CAD 9000 per flight hour.

The 109th ANG wing essentially transports scientists and their equipment from the continental US to research bases in Greenland, and sometimes even on to the ice sheet, in return for full-cost payment from the NSF. The NSF-ANG full-cost special airlift arrangement (SAAM) delivers one C-130 transport plane flight hour for about CAD 9000.

In Canada, by comparison, High Arctic researchers generally travel to the main Polar Continental Shelf Project (PCSP) research base in Resolute, Nunavut, via commercial flights. A single Ottawa to Resolute round-trip ticket is about CAD 4000. But this ticket only comes with a 32 kg baggage allowance, and researchers are generally heavy packers. With checked bag penalties reaching almost CAD 200, it is easy to spend another CAD 1000 on baggage over above ticket price. Often, there is also an institutional overhead of about 40% on commercial purchases, meaning funding agencies ultimately pay close to CAD 7000 to get a single Canadian researcher and their equipment to Resolute; not far off a C-130 flight hour.

Flights to Resolute might seem like an esoteric topic, but Canada sends a lot of researchers there. The PCSP supports approximately 850 field researchers each year. That means at least CAD 3.4M in the direct cost of commercial air tickets, or closer to CAD 6.0M when indirect (overhead and baggage) costs are factored in. The NSF-ANG partnership seems to suggest that Canada could be getting more bang for these bucks. For example, while commercially flying ten researchers and equipment roundtrip between Ottawa and Resolute is about CAD 70K (incl. indirect costs), the ANG can fly more than twice that payload on the same route for about 81K. The ANG can even land that payload “open field” far from any airport.

025 Apr 23, 6 35 31 AM

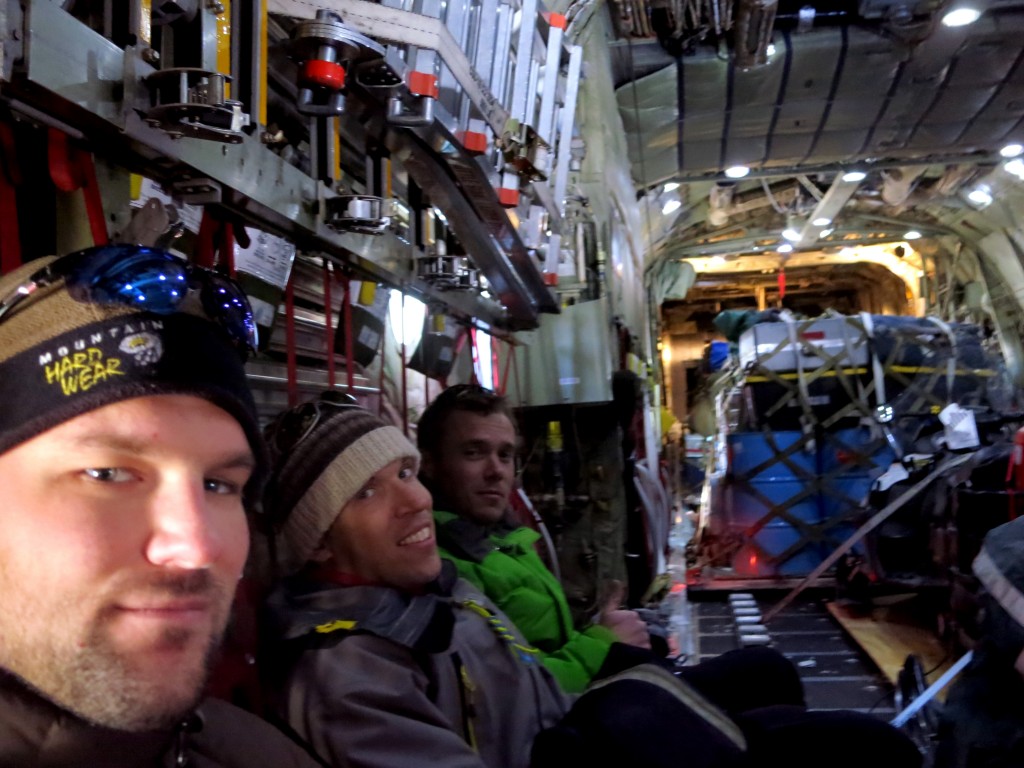
Researchers and equipment in a US Air National Guard C-130, en route to the Greenland Ice Sheet Dye-2 ski-way, during the Arctic Circle Traverse 2013 (ACT13) campaign.

Adopting a civilian-military partnership for Canadian Arctic research would clearly improve the return on expenditure for Canadian research agencies, while also providing an almost zero-cost mechanism for increased military presence in the Canadian Arctic, which translates into enhanced standby transport or search-and-rescue capacity. The NSF-ANG partnership also shows that in addition to producing tangible benefits, “soft” benefits associated with direct, widespread, and meaningful interaction between military and civilian personnel can be cultivated.

So, I am delighted to hear that the Canadian military is learning how to build ski-ways on which ANG C-130s can land. For an Arctic researcher like myself, the next ideal step would be getting skis on a Canadian C-130 (technically converting it into an LC-130), and then getting research agencies to pay the military to fly that ski-equipped C-130 to some useful field sites throughout the Canadian High Arctic!

Tags: , , , , , , , ,

FirnCover 2016 Greenland expedition route

Posted by William Colgan on March 15, 2016
New Research / Comments Off on FirnCover 2016 Greenland expedition route

Our Arctic Circle Traverse 2016 (“ACT16”) campaign is getting underway next month, and one look at the expedition map and it seems like we’ve outgrown our name! The ACT expedition series began in 2004, as snowmobile traverses roughly aligned with the Arctic Circle (66 °N) in support of the NASA Program for Arctic Regional Climate Assessment (PARCA). Since the 2013 initiation of the NASA FirnCover program, however, there has been a strong motivation to simultaneously sample more remote sites on the ice sheet. Firn compaction rate, the key process that FirnCover seeks to measure and model, is sensitive to both air temperature and snowfall rate. That means firn compaction rates vary with latitude and elevation, so when the FirnCover team goes to Greenland, we try to sample the ice sheet from North-South and low-high. That makes for a lot of travel!

ACT16_expedition_route

Figure 1 – Logistics behind our Arctic Circle Traverse 2016 (ACT16) expedition route. Red denotes US Air National Guard flights. Purple denotes NSF charter flights. Green denotes commercial flights. Blue denotes snowmobile traverses.

This April the ACT16 team will gather in Schenectady, NY to hitch a ride to Kangerlussuaq, GL with the US Air National Guard. After a pause in Kanger, the 109th Airlift Wing will deliver us to their Camp Raven skiway near Dye-2 in the ice sheet interior. Once in the ice sheet interior, the ACT16 team will fission into two groups, with a base group staying at Dye-2 for detailed firn measurements, and a traverse group snowmobiling to firn instrumentation sites along the Arctic Circle. Afterwards, our two groups will join up and catch an NSF charter flight off the ice to Kanger for some brief decompression. Then a subset of the ACT16 team will fly north to Summit and the NEGIS deep coring site for more firn instrumentation and measurements. Eventually we’ll make our way back to Kanger and head home on commercial flights via Iceland. With military and NSF charter flights, temperamental snowmobiles, and a mix of commercial airlines, the logistics for this five week field season are pretty intense!

C130_icecap

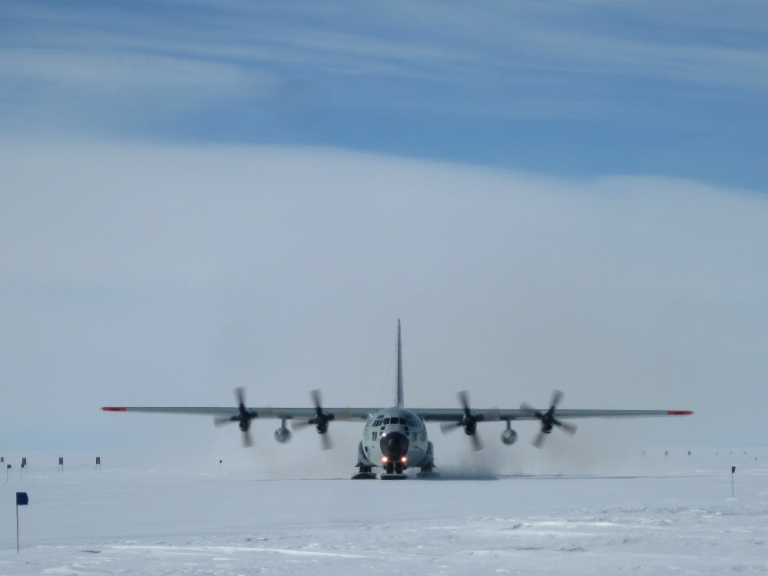
Figure 2 – A ski-equipped C-130 from the 109th Airlift Wing of the US Air National Guard taxiing on the Camp Raven skiway near Dye-2 during ACT13.

I’m most excited to visit NEGIS, not because I think it will be any more (or less) spectacular than any other location in the ice sheet interior, but simply because I haven’t been there before. A new dot on the map is always cause for delight. This field season, however, I will be keeping track of my personal carbon footprint, and I expect the charter flight to NEGIS and back is going to figure prominently in that calculation.

This post is cross-posted on the FirnCover blog.

Tags: , , , , , , , ,