BLOG

ice

Geothermal Influence on Basal Ice Temperatures

Posted by William Colgan on January 28, 2024
Climate Change, Communicating Science, New Research / No Comments

We have a new open-access study out in the current volume of The Cryosphere that looks at geothermal heat flow beneath the Greenland Ice Sheet. Geothermal heat flow is an important boundary condition for ice flow models because it influences the temperature of the ice-bed interface, which in turn influences how easily ice can deform and flow. Right now, there are about seven widely used estimates of geothermal heat flow beneath the Greenland Ice Sheet (Figure 1). These different heat flow maps come from different research groups, using different methods. It hasn’t been entirely clear what the influence of choice of heat flow map has on modeled ice flow. For example, the ensemble of Greenland ice flow projections within the Ice-Sheet Model Inter-comparison Project for CMIP6 (ISMIP6) used differing heat flow maps. Our new study simply spins up a Greenland ice flow model with all seven heat flow maps and tries to understand the resulting differences in ice thickness and velocity.

Figure 1 – The differences in the magnitude and spatial distribution of geothermal heat flow, relative to ensemble mean, in the seven Greenland geothermal heat flow maps we assessed in this study.

Although the average geothermal heat flow only varies by about ±10 mW/m2 across the seven heat flow maps, there are pronounced variations in the spatial distributions of this heat flow. This means that there can be local heat flow differences of up to ±100 mW/m2 between individual heat flow maps. When the ice sheet model is spun up in a fully transient mode with these different heat flow maps, there are lots of areas where the difference in ice thickness from ensemble mean exceeds ±150 meters (Figure 2). This is due to spatial differences in basal ice temperatures, which strongly influence the viscosity and deformation of ice. Across the seven transient spin ups, the discharge of icebergs into the ocean varies by about ±10 gigatonnes per year, which is equivalent to about ±2.5% of the total ice-sheet iceberg discharge.

Figure 2 – The differences in ice thickness after a fully transient 10,000 year spin up, relative to ensemble mean, associated with the seven Greenland geothermal heat flow maps we assessed in this study.

We also spun up the ice flow model with the seven different heat flow maps under a so-called “nudged” spin up that was a key part of ISMIP6. Unlike a fully transient spin up, a “nudged” spin up constrains modeled ice thicknesses with observed ice thicknesses; it generally ensures a very realistic geometry for the simulated ice sheet. Although the ice geometry is more-or-less constant across these “nudged” simulations, there are still pronounced differences in the magnitude and spatial distribution of ice velocity. This largely results from large differences in the extents of the frozen and thawed ice-bed areas. Depending on choice of heat flow map, between 22 and 54% of the ice-bed area is simulated as thawed (Figure 3). This has strong implications for the proportion of the ice sheet beneath which water-dependent processes, like basal sliding, can occur.

Figure 3 – The differences in temperature at the ice-bed interface after a nudged ISMIP6-style spin up, relative to pressure melting point, associated with the seven Greenland geothermal heat flow maps we assessed in this study.

So, what is the way forward after showing that the choice of heat flow map has a non-trivial impact on Greenland ice sheet simulations? Well, deciding which heat flow map is “the best” is one approach. We highlight a small, but growing, database of in situ temperature measurements against which simulated ice temperatures can be compared. There are also qualitative hints as to which heat flow map might be most appropriate. For example, does it preserve the widespread frozen basal conditions that we find in North Greenland? In terms of community ice-sheet projections, we recommend that it may be prudent to limit the direct inter-comparison of ice-sheet simulations to those using a common heat-flow map. In terms of ISMIP specifically, we suggest that future ensemble should perhaps use a range of basal geothermal forcing scenarios, similar to how it employs a range climate forcing scenarios.

Zhang, T., Colgan, W., Wansing, A., Løkkegaard, A., Leguy, G., Lipscomb, W. H., and Xiao, C.: Evaluating different geothermal heat-flow maps as basal boundary conditions during spin-up of the Greenland ice sheet, The Cryosphere, 18, 387–402, https://doi.org/10.5194/tc-18-387-2024, 2024.

Tags: , , , , , , , , , ,

Greenland Bedrock Uplift and Iceberg Discharge

Posted by William Colgan on August 22, 2021
New Research / Comments Off on Greenland Bedrock Uplift and Iceberg Discharge

We have a new open-access study linking bedrock uplift and iceberg discharge at three major Greenland outlet glaciers in the last issue of Geophysical Research Letters. We look at recent changes in observed uplift rates and ice discharges at Jakobshavn, Kangerlussuaq and Helheim Glaciers. The idea of the study was to explore what we thought was a rather straightforward relation between uplift and discharge – uplift rates are relatively high when discharge rates are relatively high (and vice versa) – and see if there as any predictive power in this relation.  

The uplift rates are observed at GNet GPS stations and the ice discharges are observed by satellite-derived ice velocity combined with knowledge of ice thickness. When we analyzed these records, we found that the uplift-discharge relation is indeed very statistically strong, but – rather counterintuitively – at two of the glaciers it was bedrock uplift that serves as a good predictor for ice discharge. Simply put, rather than changes in bedrock uplift lagging changes in ice discharge, we instead found that changes in ice discharge lag changes in bedrock uplift. Clearly, surface mass balance is the primary and instantaneous driver of elastic bedrock uplift; bedrock uplift increases immediately after a big melt and runoff event. We are effectively showing that the associated ice discharge response is lagged.

Figure 1 (a) Predicted detrended dynamic ice loss from past GNet GPS data at Jakobshavn Glacier (blue curve) and satellite-observed ice discharge (black curve). (c) Same as (a) but for Helheim Glacier. (d) Cumulative dynamic records instead of detrended records. (f) Same as (d) but for Helheim Glacier. Note the differing offsets between records at Jakobshavn and Helheim Glaciers.

At Jakobshavn Glacier, changes in ice discharge appear to lag changes in bedrock uplift by almost one year (0.87 years). Simply put, if there is a big melt and uplift event in August, the ice discharge response will peak the following June. If we trust this relation, recent uplift observations at Jakobshavn Glacier suggest that ice discharge will return to pre-2018 levels by the end of 2021. This would mark a clear end to a three-year period of relatively low ice discharge and ice-sheet thickening in the lower reaches of the ice stream over the 2016-2018 melt seasons. At Helheim Glacier, by contrast, there was no significant lead or lag; changes in uplift rate seem completely coincident with changes in ice discharge. Simply put, peak uplift and ice dischrage tends to be simultaneous.

Figure 2 Locations of the KAGA G-Net station at Jakobshavn Glacier (left) and the HEL2 G-Net station at Helheim Glacier. The relation between bedrock uplift and ice discharge is dependent on many local factors like geology, ice configuration, and glacier hydrology.

You can speculate that this uplift-discharge relation changes from glacier to glacier around Greenland due on local differences in bedrock geology and glacier dynamics or hydrology. Reflecting, for example, the elastic modulus of the bedrock or the reservoir time of englacial hydrology of each glacier. The sensitivity of this relation – meaning how many mm/yr uplift per Gt/yr mass loss – also varies from GPS station to GPS station based on the local ice configuration and distance of the GPS station to the center of ice loss. These relations are therefore only valid over local scales.

Overall, however, it does seem possible to use the GNet stations to develop local relations between bedrock uplift and ice discharge on a glacier-by-glacier basis all the way around Greenland. This would be very helpful for using GPS stations to reconstruct detailed records of local ice loss prior to the 2016 onset of weekly satellite monitoring of ice discharge. Exploring this uplift-discharge relation at more GNet stations may also help us understand exactly why sub-annual changes in ice discharge appear to be lagging changes in vertical bedrock motion at some glaciers. Any new clues about processes that regulate Greenland’s ice discharge into the ocean are always valuable!

Hansen, K., Truffer, M., Aschwanden, A., Mankoff, K., Bevis, M., Humbert, A., van den Broeke, M., Noel, B., Bjørk, A., Colgan, W., Kjær, K., Adhikari, S., Barletta, V., and S. Khan. (2021). Estimating ice discharge at Greenland’s three largest outlet glaciers using local bedrock uplift. Geophysical Research Letters, 48, e2021GL094252. https://doi.org/10.1029/2021GL094252

Tags: , , , , , , , , , , ,

‘Cold Content’ of Greenland’s Firn Plateau

Posted by William Colgan on April 29, 2020
Climate Change, Communicating Science, New Research / Comments Off on ‘Cold Content’ of Greenland’s Firn Plateau

We have a new open-access study in the current issue of Journal of Glaciology that investigates the “cold content” of Greenland’s high-elevation firn plateau1. Firn is the relatively low density near-surface ice-sheet layer comprised of snow being compressed into ice. Cold content is one of its quirkier properties. Of course, all firn is literally freezing – meaning below 0°C – but some firn is colder than other firn. Clearly, it takes a lot more energy to warm -30°C firn to 0°C, than it does for -1°C firn. Our study highlights at least one discernible shift in cold content – how much sensible heat energy is required to warm firn to the 0°C melting point – in response to climate change.

Figure 1 – The nine high-elevation ice-sheet sites where we assessed firn cold content in the top 20 m.

There is a strong annual cycle in firn cold content. Generally, cold content is at its maximum each April, after the firn has been cooled by winter air temperatures. Cold content then decreases through summer, as warming air temperatures and meltwater percolation pump energy into the firn, to reach a minimum each September. The magnitude of this annual cycle varies across the ice sheet, primarily as a function of the meltwater production, but also as a function of snowfall-dependent firn density. Firn density is highly sensitive to snowfall rate, and firn cold content is a function of firn density.

Figure 2 – The mean annual cycle in four-component firn cold content assessed at the nine ice-sheet sites over the 1988-2017 period. Note the relatively large latent heat release associated with meltwater at Dye-2, in comparison to other sites.

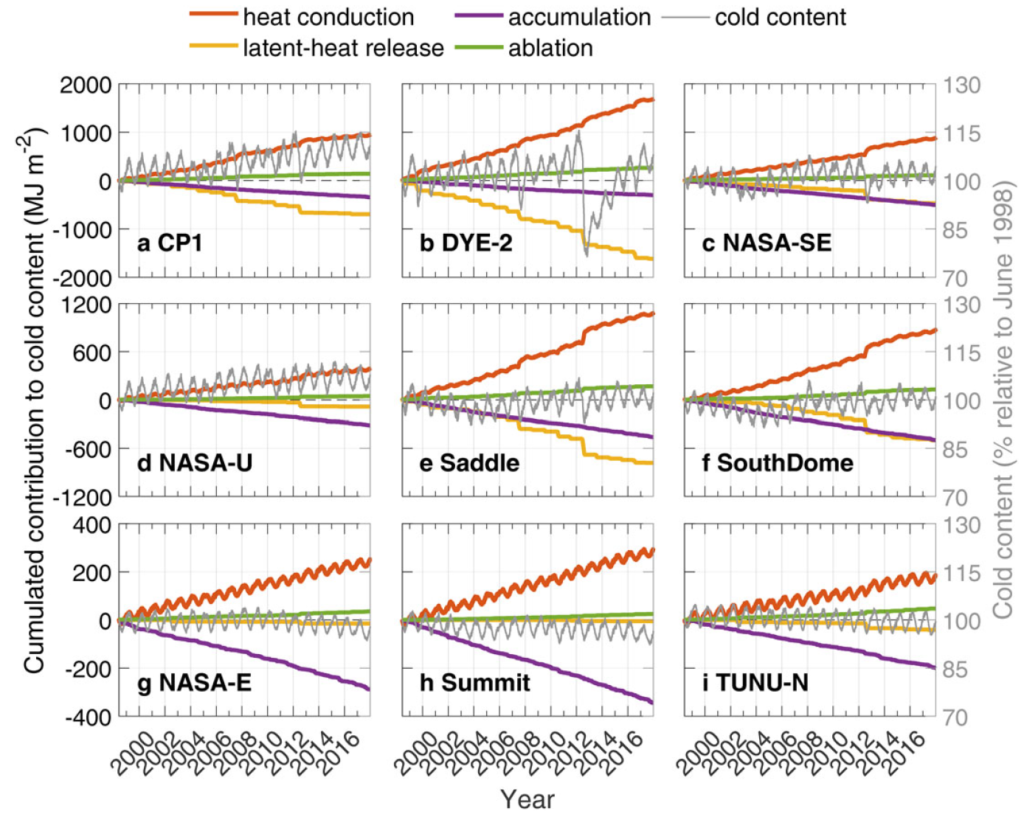
We find few discernible year-on-year trends in cold content across the highest elevation areas of the firn plateau. For example, there is perhaps a slight decrease at Summit – where we find snowfall is increasing at 24 mm/decade and air temperatures are warming at 0.29°C/decade – but statistically-significant multi-annual trends in cold content are difficult to separate from year-to-year variability. At Dye-2, however, which has the greatest melt rate of the sites that we examine, there is clear evidence of the impact of changing climate. At Dye-2, an exceptional 1-month melt event in 2012 removed ~24% of the cold content in the top 20 m of firn. It took five years for cold content to recover to the pre-2012 level.

Figure 3 – The cumulative four-component firn cold content at the nine ice-sheet sites over the 1998-2017 period. Note the sharp loss of Dye-2 cold content in 2012, and the subsequent multi-year recovery of this cold content.

The refreezing of meltwater within firn is a potential buffer against the contribution of ice-sheet melt to sea-level rise; surface melt can refreeze within porous firn instead of running off into the ocean. But refreezing meltwater requires available firn cold content. The multi-annual reset of cold content that we document at Dye-2 suggests that a single melt event can reduce firn cold content – and thus precondition firn for potentially less meltwater refreezing – for years to follow. This highlights the potential for the cold content of Greenland’s firn plateau to decrease in a non-linear fashion, as climate change pushes melt events to progressively higher elevations of the firn plateau.

1Vandecrux, B., R. Fausto, D. van As, W. Colgan, P. Langen, K. Haubner, T. Ingeman-Nielsen, A. Heilig, C. Stevens, M. MacFerrin, M. Niwano, K. Steffen and J. Box. 2020. Firn cold content evolution at nine sites on the Greenland ice sheet between 1998 and 2017. Journal of Glaciology..

Tags: , , , , , , , , , ,

Rapid Sampling of Ice-Sheet Temperatures

Posted by William Colgan on September 10, 2018
Applied Glaciology, New Research / 1 Comment

We are starting a new two-year project to design, build and deploy a new type of ice-drill to measure temperatures at the ice-bed interface of the Greenland Ice Sheet. Why? Because we are unsure whether the bed is frozen or thawed beneath about one third of the ice sheet. As the rate at which ice flows is dependent on ice temperature – and basal ice temperature in particular – this translates into uncertainty in simulations of how ice sheet form and flow will evolve over time.

We suspect that climate change is likely driving an expansion of the thawed-bedded portion of the ice sheet — eroding the frozen-bedded portion — over time. But in the last sixty years, direct temperature measurements of the ice-bed interface have only been made at six inland ice-sheet locations. These scarce, but tremendously valuable, basal ice temperatures have been measured at the sites of ice core deep-drilling projects. These deep-drilling projects take months or even years to create a 30 cm wide borehole to the ice-sheet bed from which to retrieve delicate ice core.

Figure 1 – Schematic of the HOTROD melt-tip and cross-section of the umbilical cord. The umbilical cord will both power the melt-tip as well as contain embedded ice-temperature sensors.

This project will design, build and deploy a drill for rapid sampling of ice-sheet basal temperatures. HOTROD will use an approximately 5KW electric melt-tip to open 3 cm wide access boreholes to depths of 500 m within days. The HOTROD umbilical cord will not only power the melt-tip, but also have embedded temperature sensors that — with the melt-tip — make a one-way trip to the ice-sheet bed. The heart of the melt-tip will be recently designed heating elements intended for rapid heating of energy-efficient domestic hot water supplies.

In 1971, thermal drilling was used to recover the top 372 m of ice core at Dye-3. The Dye-3 deep ice core was subsequently completed to 2037 m with electro-mechanical drilling in 1981. Thermal drilling technology was last used in Greenland in 1974, to recover a 403 m ice core at Crete, Greenland1. While there’s been numerous hot-water drilling projects since then, the working memory of thermal drilling is fading. The goal of this project is to successfully deploy a melt-tip thermal drill to measure a 500 m deep ice-sheet temperature profile with less than ten days of drilling. Initial field-testing activities will begin in 2019.

Figure 2 – The Dye-3 ice-drilling trench. In comparison to the multi-year logistical footprints of deep ice-coring projects, the HOTROD melt-tip drill will require trace logistics.

We hope that the advent of rapid melt-tip drilling will be a disruptive technology within the sphere of ice-sheet research now dominated by conventional electro-mechanical and hot-water drilling systems. A concerted effort to sample more temperatures at the ice-bed interface may potentially shift our understanding of ice-sheet basal temperatures and even ice-sheet sensitivity to climate change. This project is funded by Villum Experiment, a programme of Villum Foundation that funds science and engineering projects that challenge the norm and have the potential to transform traditional approaches2.

1Langway, C. 2008. The History of Early Polar Ice Cores. Cold Regions Research and Engineering Laboratory. Technical Report 08-1.

2Villum Foundation. 2018. 53 bold ideas receive funding from VILLUM FONDEN.

Tags: , , , , , ,