BLOG

meltwater

Future of East Rongbuk Glacier

Posted by William Colgan on May 13, 2024
Climate Change, Communicating Science, New Research / No Comments

We have a new study out that looks at the fate of East Rongbuk Glacier under the current range of IPCC Shared Socioeconomic Pathways (SSPs). East Rongbuk Glacier is located on the north slope of Mount Everest, also called Chomolungma, where the climate is very cold and dry. The relatively little snowfall at East Rongbuk Glacier makes it sensitive to small increases in surface melt associated with climate change. Many different glaciological observations, including surface mass balance, ice thickness and ice temperature, have been collected at East Rongbuk Glacier by different teams working at the site over many years. This makes it a relatively data rich glacier site within high mountain Asia.

Figure 1 – East Rongbuk Glacier outlined on the north slope of Mount Everest (Chomolungma). Colors depict ice surface velocities overlaid on a satellite image of the Himalayas. Red dots denote boreholes.

In this study, we simulate East Rongbuk Glacier with an ice flow model. The surface forcing of the ice flow model is the magnitude and spatial distribution of accumulation and ablation, as well as surface temperatures. We use climate data from ten different CIMP6 ensemble members as surface forcing. The model then simulates the thickness, temperature and velocity of the glacier that fits with this surface forcing. Once we ensure that the model simulates the present-day glacier thickness, temperature and velocity, as well as recently observed ice loss, we apply the SSP-126 (low emissions), SSP-370 (middle of the road) and SSP-585 (high emissions) climate projections of the CIMP6 ensemble. The model then simulates the changing form and flow of the glacier under these future scenarios.

Although we use ten CMIP6 climate forcings, we generally focus on the pattern revealed by the ensemble mean, rather than any one particular CMIP6 climate projection. We find that under the SSP-126 scenario, East Rongbuk Glacier will likely experience maximum, or peak, meltwater runoff around 2030. About 55% of the glacier volume will remain at the end of this century. Under the SSP-370 and SSP-585 scenarios, the peak water will likely occur around 2060. Under these scenarios, less than 30% of the glacier volume will remain at the end of this century. While glacier volume less per year is decreasing by the end of the century under SSP-126, it is still decreasing quite rapidly under SSP-370 and SSP-585. This suggests that adopting SSP-126 would have a significant impact on stabilizing the volume of East Rongbuk Glacier. This may be characteristic of broadly similar glaciers in high mountain Asia.

Figure 2 – Normalized cumulative volume and area changes of East Rongbuk Glacier during 2010–2100 under three IPCC climate scenarios (SSP-126, SSP-370, and SSP-585). Dotted color lines represent the ten individual CMIP6 ensemble members, while the thick black line represents ensemble mean.

We do a variety of simulations to test the sensitivity of these projections against assumptions of the model. These sensitivity simulations highlight the importance of including ice dynamics, which change glacier geometry, when projecting meltwater runoff decades into the future. Many projections of glacier runoff in high mountain Asia do not yet include changes in ice geometry over time. While important, however, the impact of incorporating ice dynamics into glacier projections is still limited in comparison to the choice of climate forcing. Individual members of the CMIP6 climate forcing ensemble can yield very different projections. For example, a “high sensitivity” CMIP6 member suggests that East Rongbuk Glacier may disappear completely by the end of the century under SSP370, while a “low sensitivity” CMIP6 member suggests that 40% of the glacier may remain at the end of the century under SSP585. This highlights the substantial uncertainty in our present understanding of the fate of East Rongbuk Glacier.

Zhang, T., Wang, Y., Leng, W., Zhao, H., Colgan, W., Wang, C., Ding, M., Sun, W., Yang, W., Li, X., Ren, J., and Xiao, C. 2024. Projections of Peak Water Timing From the East Rongbuk Glacier, Mt. Everest, Using a Higher-Order Ice Flow Model. Earth’s Future. 12, e2024EF004545. https://doi.org/10.1029/2024EF004545

Tags: , , , , , , , ,

‘Cold Content’ of Greenland’s Firn Plateau

Posted by William Colgan on April 29, 2020
Climate Change, Communicating Science, New Research / Comments Off on ‘Cold Content’ of Greenland’s Firn Plateau

We have a new open-access study in the current issue of Journal of Glaciology that investigates the “cold content” of Greenland’s high-elevation firn plateau1. Firn is the relatively low density near-surface ice-sheet layer comprised of snow being compressed into ice. Cold content is one of its quirkier properties. Of course, all firn is literally freezing – meaning below 0°C – but some firn is colder than other firn. Clearly, it takes a lot more energy to warm -30°C firn to 0°C, than it does for -1°C firn. Our study highlights at least one discernible shift in cold content – how much sensible heat energy is required to warm firn to the 0°C melting point – in response to climate change.

Figure 1 – The nine high-elevation ice-sheet sites where we assessed firn cold content in the top 20 m.

There is a strong annual cycle in firn cold content. Generally, cold content is at its maximum each April, after the firn has been cooled by winter air temperatures. Cold content then decreases through summer, as warming air temperatures and meltwater percolation pump energy into the firn, to reach a minimum each September. The magnitude of this annual cycle varies across the ice sheet, primarily as a function of the meltwater production, but also as a function of snowfall-dependent firn density. Firn density is highly sensitive to snowfall rate, and firn cold content is a function of firn density.

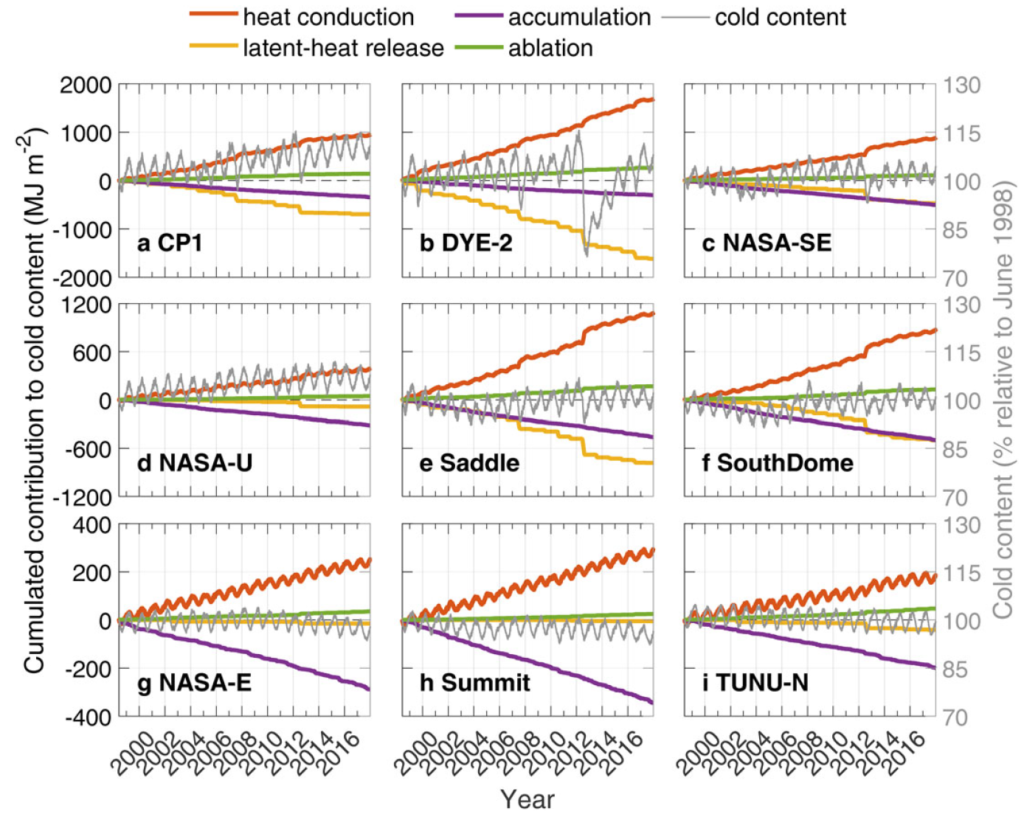
Figure 2 – The mean annual cycle in four-component firn cold content assessed at the nine ice-sheet sites over the 1988-2017 period. Note the relatively large latent heat release associated with meltwater at Dye-2, in comparison to other sites.

We find few discernible year-on-year trends in cold content across the highest elevation areas of the firn plateau. For example, there is perhaps a slight decrease at Summit – where we find snowfall is increasing at 24 mm/decade and air temperatures are warming at 0.29°C/decade – but statistically-significant multi-annual trends in cold content are difficult to separate from year-to-year variability. At Dye-2, however, which has the greatest melt rate of the sites that we examine, there is clear evidence of the impact of changing climate. At Dye-2, an exceptional 1-month melt event in 2012 removed ~24% of the cold content in the top 20 m of firn. It took five years for cold content to recover to the pre-2012 level.

Figure 3 – The cumulative four-component firn cold content at the nine ice-sheet sites over the 1998-2017 period. Note the sharp loss of Dye-2 cold content in 2012, and the subsequent multi-year recovery of this cold content.

The refreezing of meltwater within firn is a potential buffer against the contribution of ice-sheet melt to sea-level rise; surface melt can refreeze within porous firn instead of running off into the ocean. But refreezing meltwater requires available firn cold content. The multi-annual reset of cold content that we document at Dye-2 suggests that a single melt event can reduce firn cold content – and thus precondition firn for potentially less meltwater refreezing – for years to follow. This highlights the potential for the cold content of Greenland’s firn plateau to decrease in a non-linear fashion, as climate change pushes melt events to progressively higher elevations of the firn plateau.

1Vandecrux, B., R. Fausto, D. van As, W. Colgan, P. Langen, K. Haubner, T. Ingeman-Nielsen, A. Heilig, C. Stevens, M. MacFerrin, M. Niwano, K. Steffen and J. Box. 2020. Firn cold content evolution at nine sites on the Greenland ice sheet between 1998 and 2017. Journal of Glaciology..

Tags: , , , , , , , , , ,

Lost Ice-Sheet Porosity and Sea-Level Buffering

Posted by William Colgan on March 12, 2019
New Research, Sea Level Rise / Comments Off on Lost Ice-Sheet Porosity and Sea-Level Buffering

We have a new open-access study that investigates the high-elevation firn plateau of the Greenland Ice Sheet in the current issue of The Cryosphere1. Firn is the relatively low density near-surface ice-sheet layer comprised of snow being compressed into ice. Firn is relatively porous, meaning that meltwater can percolate through it. The refreezing of meltwater within firn is a potential buffer against the ice-sheet sea-level contribution from surface melt; surface melt can refreeze within porous firn instead of running off into the ocean. Our study aims to assess how big this sea-level buffer might be, and how much sea-level buffer may have already been used.

We pull together a singularly unique dataset – 340 ice-core measurements of firn density collected over 65 years – to assess the near-surface density across the entire high-elevation firn plateau of the Greenland Ice Sheet. Many of these vertical firn density profiles were digitized and brought together for the first time from historical studies, but twenty are collected by our team and new to science. We analyze this ice-core dataset for empirical relations between firn density and accumulation or air temperature. This allows us to divide the ice sheet into three distinct firn areas, within each of which we can confidently predict the vertical profile of near-surface firn density.

Figure 1 – Left: Firn air content within the top 10 m (FAC10) estimated from ice-core measurements (denoted with ‘x’). The ice sheet is divided into three areas: the Dry Snow Area (DSA), the Low Accumulation Percolation Area (LAPA), and the High Accumulation Percolation Area (HAPA). Right: Change in top 10 m firn air content between 1998–2008 and 2010–2017 within Low Accumulation Percolation Area along the ice sheet’s western flank.

We find that the firn structure at the heart of the ice sheet – the highest, coldest and driest firn known as the Dry Snow Area – appears to have been stable since 1953. There is no trend in firn density within the Dry Snow Area. At lower elevations, however, we find significant changes in response to recent increases in surface melt due to climate change. The area we call the Low Accumulation Percolation Area – an elevation band of relatively low snowfall and high melt along the ice sheet’s west flank – has a marked increase in the firn densities measured pre- and post-2009. This firn density change is equivalent to a sea-level buffer loss of 1.5±1.2 mm sea-level equivalent (540±440 gigatonnes).

We compare the ice-sheet-wide firn density structure that we estimate from ice-core measurements with the firn density structure estimated from three regional climate models. The regional climate models suggest that the decrease in firn porosity initiated in the early 2000s and accelerated with post-2010 climate change. But we also find non-trivial differences between the firn porosities simulated by regional climate models, and that inferred from ice-core measurements, especially in what we call the High Accumulation Percolation Area. Here – the ice sheet’s low elevation southeast flank – modeled firn porosity can be biased the equivalent of between 3 and 7 meters of air distributed over the entire firn column depth.

Figure 2 – Left: Ice-sheet-wide firn air content within the top 10 m of firn (FAC10) simulated by three regional climate models (MAR, HIRHAM and RACMO) and derived from ice-core observations (this study) in different ice-sheet areas. Right: Same for firn air content over the entire depth of the firn column (FACtot).

This study highlights the importance of bringing together firn density measurements to document the response of ice-sheet firn – a non-trivial component of the sea-level budget – to recent climate change. The ice-sheet-wide firn porosity structure we infer from ice-core measurements can also serve as an independent evaluation target for the firn porosity structures simulated by regional climate models. This study also illustrates how new insight can be obtained from the synthesis and re-analysis of historical datasets. This emphasizes the tremendous value of open-access data within the scientific community. This work is part of the Retain project funded by the Danmarks Frie Forskningsfond (grant 4002-00234). The open-access publication is available via the hyperlink below.

1Vandecrux, B., MacFerrin, M., Machguth, H., Colgan, W., van As, D., Heilig, A., Stevens, C., Charalampidis, C., Fausto, R., Morris, E., Mosley-Thompson, E., Koenig, L., Montgomery, L., Miège, C., Simonsen, S., Ingeman-Nielsen, T., and Box, J. 2019. Firn data compilation reveals widespread decrease of firn air content in western Greenland. The Cryosphere. 13: 845-859. https://doi.org/10.5194/tc-13-845-2019.

Tags: , , , , , , ,

Draining the Ice-Sheet: Crevasses vs Moulins

Posted by William Colgan on March 22, 2017
Climate Change, New Research / Comments Off on Draining the Ice-Sheet: Crevasses vs Moulins

We have an open-access study that explores the various ways by which meltwater drains from the Greenland ice sheet in the current volume of Journal of Glaciology1. While surface meltwater rivers and lakes are a conspicuous feature of the Greenland ice sheet, virtually all meltwater that drains from the ice-sheet margin is flowing either within or beneath the ice sheet, rather than on its surface. Where and how meltwater reaches the ice-sheet bed can have implications on ice dynamics. For example, the sharp pulses of meltwater transmitted to the bed by near-vertical conduits called moulins are believed to cause more sliding at the ice-bed interface than the subdued pulses transmitted by crevasses.

In the study, we simulated a portion of the ice sheet in West Greenland known as Paakitsoq, using a computer model. The model used the measured ice sheet topography, as well as observed locations of crevasses and moulins, to simulate how meltwater was produced and flowed across the ice sheet surface under the climate conditions of the 2009 average intensity melt season and the 2012 extreme intensity melt season. The model could also simulate catastrophic lake drainage events, known as hydrofracture events, when a surface lake becomes sufficiently deep that its pressure fractures the underlying ice and creates a new moulin.

Figure 1 – Location of the Paakitsoq study area. Black outline denotes the model domain. Blue dots denote moulin locations identified in satellite imagery. Black contours denote surface elevations. Base image is Landsat-8 from 4 August 2014.

Our simulations suggested that, during an average intensity melt season, crevasses drain almost half (47 %) of ice-sheet meltwater. The hydrofracture of surface lakes drained about 24 % of ice-sheet meltwater, the majority of which resulted from drainage into new moulins following hydrofracture events, rather than the hydrofracture events themselves. Previously existing moulins drained an additional 15 % of meltwater. (The remaining meltwater either reached the ice-sheet margin, remained stored within the model area, or drained to ice-sheet areas North or South of the model area.)

While our simulations suggest that crevasses now drain more meltwater from the ice sheet at Paakitsoq (47 %) than previously existing and newly hydrofractured moulins together (39 %), our 2012 extreme intensity melt season simulation suggests that this ratio may change. The proportion of meltwater drainage via moulins increases, and the proportion of drainage via crevasses decreases, in the 2012 extreme intensity melt season simulation, which may be characteristic of a warmer future climate. This increase in both relative and absolute moulin drainage under warmer conditions is due to an increase in moulins created by hydrofracture events, as meltwater production moves to higher elevations.

Figure 2 – Partitioning surface meltwater drainage into eight categories under the average melt (2009; R1) and extreme melt (2012; R11) simulations. “Lake” is the volume remaining in lakes at season end. “Remaining Flow” is the volume in transit at season end. “Lateral Outflow” is the volume that drains through North and South model domain boundaries. “Ice Margin” is the volume that reaches the ice-sheet edge. The volumes captured in “Crevasses” and “Moulins” are denoted. The volumes drained by lake hydrofracture induced surface-to-bed connections are “Lake Hydrofracture Lake” (LHL), while the subsequent drainage into the new surface-to-bed connection is “Lake Hydrofracture Moulin” (LHM).

Overall, our study provided insight on the space-time variation of pathways by which the vast majority of ice-sheet meltwater descends to the ice-sheet bed prior to reaching the ice-sheet margin. A better understanding of how meltwater travels through the ice-sheet can help improve scientific understanding of not only the ice-sheet mass loss caused by runoff, but also the implications of increasing meltwater production on the mass loss caused ice dynamics. Our simulations also suggest there is value in ice-sheet wide mapping of surface hydrology features like crevasses, rivers, lakes, and moulins, as computer models can use this knowledge to improve simulations of meltwater routing.

1Koziol, C., N. Arnold, A. Pope and W. Colgan. 2017. Quantifying supraglacial meltwater pathways in the Paakitsoq region, West Greenland. Journal of Glaciology. 1-13. doi:10.1017/jog.2017.5

Tags: , , , , , ,

Firn Permeability: New Use of an Old Technique

Posted by William Colgan on March 06, 2017
Communicating Science, New Research / Comments Off on Firn Permeability: New Use of an Old Technique

We have a new study out this month in Frontiers in Earth Science1 that describes using an old-school hydrogeology method on the Greenland Ice Sheet. We used pump-testing, which has been conventionally used to measure soil permeability for groundwater flow, to infer the permeability of ice-sheet firn to meltwater flow. We wanted to quantitatively measure how massive ice layers formed by refreezing meltwater in the near-surface ice sheet firn could inhibit meltwater flow in subsequent years.

firn3

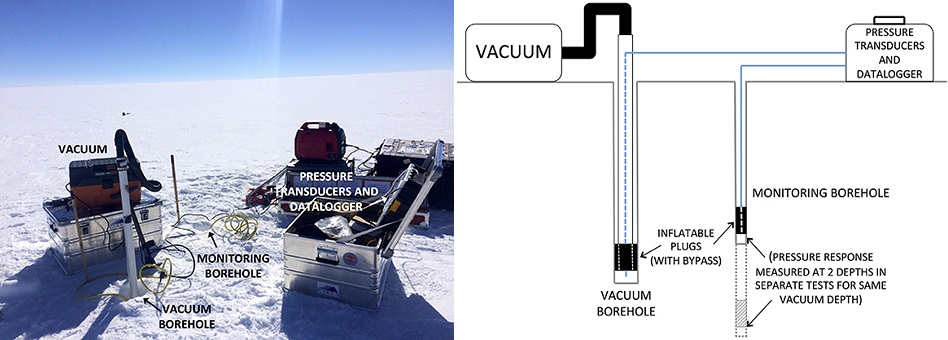
Figure 1 – The low tech and low cost pump-testing device used to infer firn permeability on the Greenland Ice Sheet. A vacuum is applied at depth in the sealed vacuum borehole and the resulting pressure response is measured in the sealed monitoring borehole.

In conventional pump-testing, water is pumped out of a borehole at a controlled rate, and the groundwater level response, or drawdown is observed in a monitoring borehole located some distance away. We did something similar in the ice-sheet firn, pumping air out of a vacuum borehole and measuring the air pressure response is a sealed monitoring borehole about one meter away. We did pump tests at six ice sheet sites that had varying degrees of massive ice layers in the near-surface firn.

We found that vertical permeability between firn layers was generally much lower than horizontal permeability within a firn layer, and that vertical permeability decreased with increasing ice content. At the lowest elevation site, where meltwater production and refreezing is most prevalent, we drilled into an exceptionally massive ice layer the pump borehole was able to maintain an effective vacuum. In other words, thick massive ice layers are indeed impermeable to fluids. That was a little surprising!

firn_permeability

Figure 2 – Inferred horizontal (kr) and vertical (kz) firn permeability values at five ice-sheet sites. Horizontal blue lines indicate the depths of ice layers at each site. Vertical cyan and magenta shading represents inferred permeability limits.

While it may sound esoteric, the permeability of near-surface firn is an increasingly visible topic in ice-sheet research. Studies have shown that firn can act to either buffer sea level rise by absorbing meltwater2, or enhance sea level rise by forming impermeable refrozen ice layers3. As climate change increases meltwater production within the historical accumulation zone of the ice sheet, a greater area of ice-sheet hydrology will be influenced by refrozen ice layers. In future, higher vacuum pressures and repeated measurements should allow firn permeability to be measured over larger scales to improve our understanding of changing firn permeability.

For now, the proof-of-concept pump-testing device is relatively low tech and low cost. Aside from air-pressure sensors and a data logger, it was constructed by items you could find at your local hardware store; plastic PVC pipes channeling the power of a shop vacuum. Development of the firn pump-testing device was initiated by a University of Colorado Dean’s Graduate Student Research Grant to highly innovative lead-author Aleah Sommers, and it was deployed in collaboration with the FirnCover project during the 2016 field campaign.

WP_20160502_004

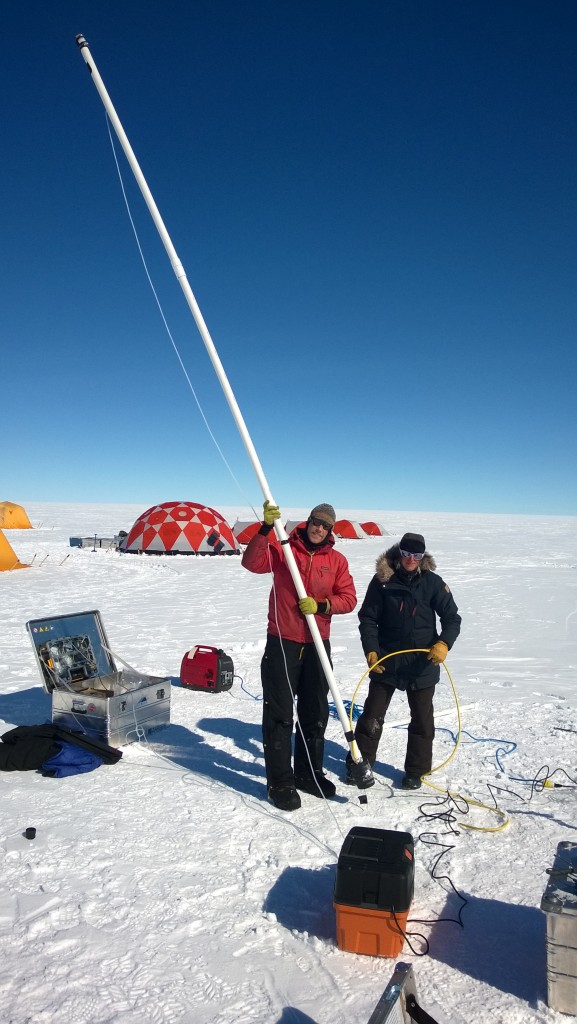
Figure 3 – Max Stevens and Aleah Sommers preparing to insert the pressure sensor and seal into the monitoring borehole at Saddle, Greenland, in May 2016.

1Sommers et al. 2017. Inferring Firn Permeability from Pneumatic Testing: A Case Study on the Greenland Ice Sheet. Frontiers in Earth Science. 5: 20.

2Harper et al. 2012. Greenland ice-sheet contribution to sea-level rise buffered by meltwater storage in firn. Nature. 491: 240-243.

3Machguth et al. 2016. Greenland meltwater storage in firn limited by near-surface ice formation. Nature Climate Change. 6: 390-393.

Tags: , , , , , , ,

Suppressed Melt Percolation in Greenland Firn

Posted by William Colgan on May 19, 2016
Climate Change, New Research / Comments Off on Suppressed Melt Percolation in Greenland Firn

We have a new open-access study in the current volume of Annals of Glaciology that tracks the fate of meltwater in the relatively porous near-surface firn of the Greenland Ice Sheet using temperature sensors1 (available here). One of the main goals of this study was to understand what fraction of the meltwater produced at the ice sheet surface percolates vertically into the firn and locally refreezes, rather than leaving the ice sheet as runoff and contributing to sea level rise. The total retention capacity of all of Greenland’s firn could be a non-trivial buffer against sea level rise2.

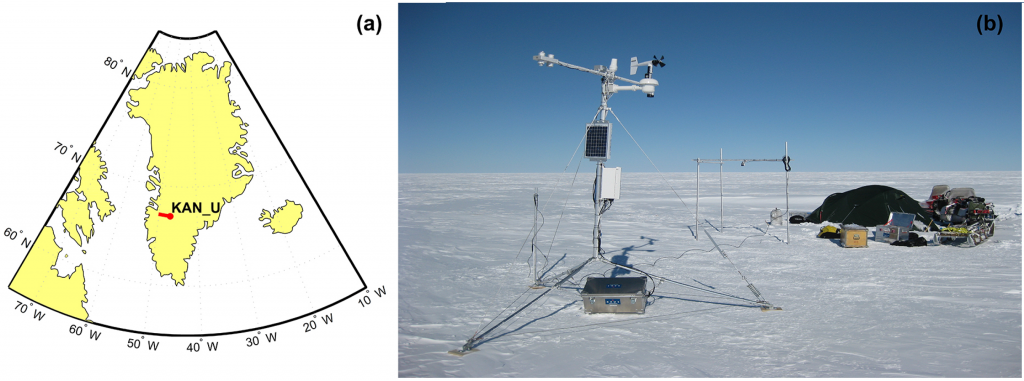
For this particular study, we deployed firn temperature sensors at depths of up to 15 m at KAN_U. The sensors were automated to record data throughout the year, between our spring sites visits. KAN_U is located at 1840 m elevation in Southwest Greenland in the lower accumulation area. While KAN_U traditionally receives more mass from snowfall than it loses from melt, our study focused on the “extreme” 2012 melt season, which was the first year since records began that there was more meltwater runoff than snowfall at the site.

Fieldwork

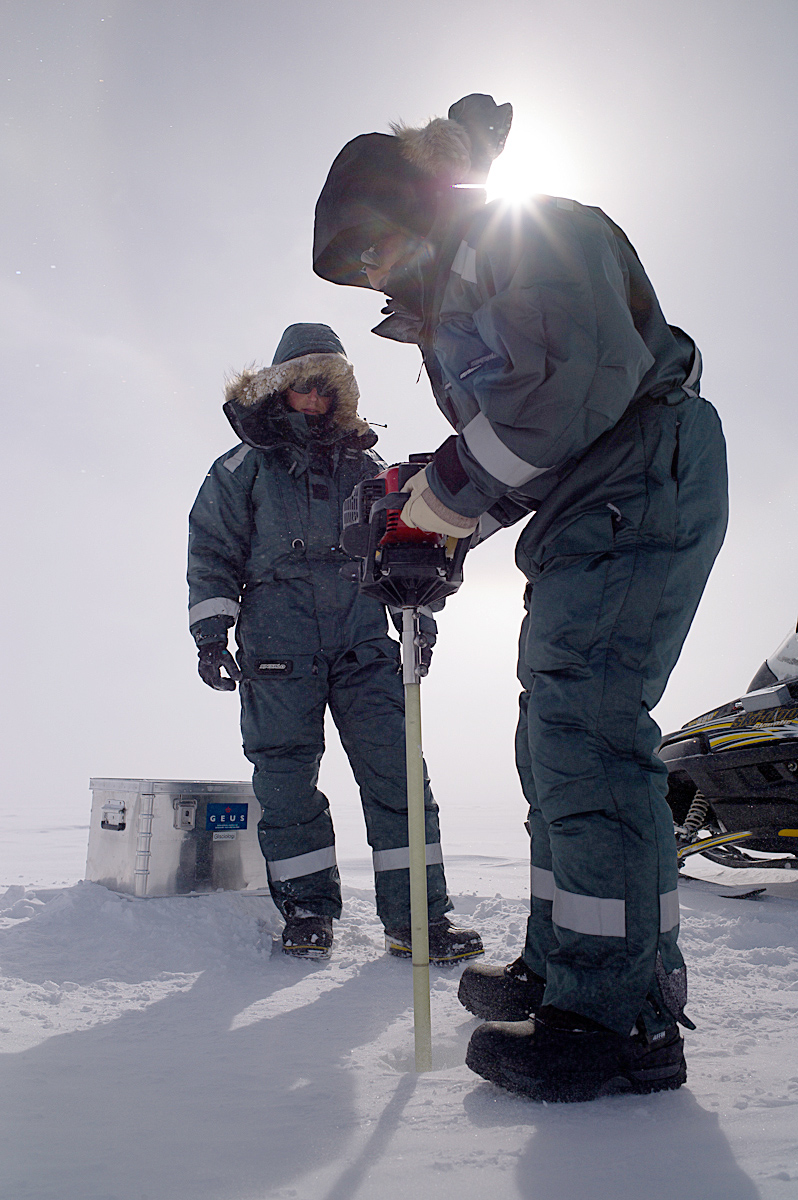
Figure 1 – Lead author Charalampos Charalampidis drilling a borehole on the Greenland Ice Sheet near KAN_U during the 2013 spring field campaign.

As refreezing meltwater releases a tremendous amount of latent energy, the location of refreezing meltwater within the firn can be inferred from temperature anomalies. We assessed temperature anomalies by comparing our observed firn temperatures against modeled firn temperatures, whereby the modeled temperatures only accounted for heat exchanged with the ice sheet surface via diffusion, not latent heat release. This allowed us to identify depths where firn temperatures were warmer than expected.

Babis_thermistor

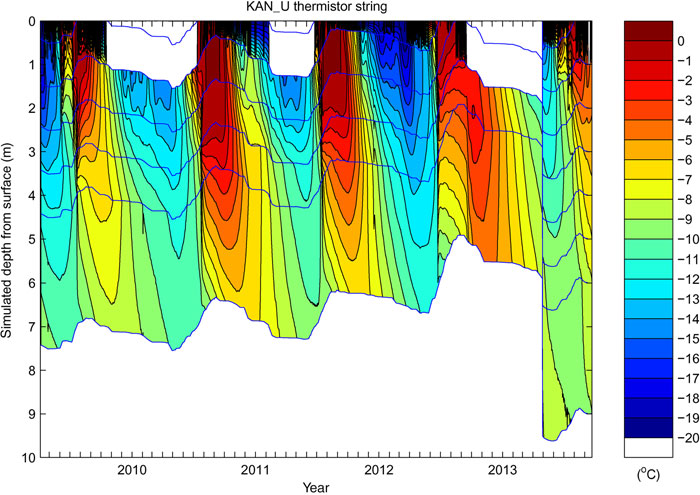
Figure 2 – Automated observations of firn temperatures in the top 10 m of firn at KAN_U over four years. There is a strong annual cycle in near-surface firn temperatures.

We found that despite 2012 being an extreme melt year, meltwater percolation and refreezing only occurred to 2.5 m depth during the melt season. It was only after the end of the melt season that some meltwater managed to percolate and refreeze in discrete bands at 5.5 and 8.5 m depth. This inference of relatively inefficient vertical meltwater percolation during the melt season appears to support the idea that thick and impermeable ice lenses that had previously formed within the firn during 2010 were inhibiting the percolation of 2012 meltwater3.

Maintaining the relatively sensitive automatic weather station needed to accurately measure firn temperatures and surface energy fluxes in the relatively harsh ice sheet environment was no easy task. It took a number of scientists and funding agencies, which are listed in the acknowledgement section of the paper, to make this study possible. The KAN_U weather station continues to report real-time climate data via the Programme for Monitoring of the Greenland Ice Sheet (PROMICE) data portal: www.promice.dk.

KAN_U_location

Figure 3 – A: Location of Kangerlussuaq Upper Station (KAN_U) on the Greenland Ice Sheet. B: A PROMICE climate station deployed to measure firn temperatures and surface energy budget.

1Charalampidis, C., D. van As, W. Colgan, R. Fausto, M. MacFerrin and H. Machguth. 2016. Thermal tracing of retained meltwater in the lower accumulation area of the Southwestern Greenland ice sheet. Annals of Glaciology. doi:10.1017/aog.2016.2.

2Harper, J., N. Humphrey, W. Pfeffer, J. Brown and X. Fettweis. 2012. Greenland ice-sheet contribution to sea-level rise buffered by meltwater storage in firn. Nature. 491: 240-243.

3Machguth, H., M. MacFerrin, D. van As, J. Box, C. Charalampidis, W. Colgan, R. Fausto, H. Meijer, E. Mosley-Thompson and R. van de Wal. 2016. Greenland meltwater storage in firn limited by near-surface ice formation. Nature Climate Change. 6: 390–393.

Tags: , , , , , , ,

New Estimate of Ice Sheet Runoff at Isua Site

Posted by William Colgan on April 14, 2015
Applied Glaciology, New Research / Comments Off on New Estimate of Ice Sheet Runoff at Isua Site

My colleague Lukas Arenson and I have a paper in the Proceedings of Mine Water Solutions in Extreme Environments this month, which uses the Isua site in Southwest Greenland as a case study for extreme runoff in proglacial environments (Arenson and Colgan, 2015). The recently approved Isua mine will be an open pit mine intersecting the ice sheet, with ice pit walls around about half the pit, to access what is presently a subglacial iron deposit (site overview here). Using a Monte Carlo approach, we estimate a 95 % (or two sigma) upper confidence limit of 2.8·109 L/day of ice sheet runoff potentially reaching the Isua site in July and August. While this potential inflow rate, equivalent to 44 t/s, is relatively large in the context of conventional mine water management, it is relatively small in the context of contemporary Greenland ice loss due to climate change, which is approximately 8,300 t/s when averaged over a year (Andersen et al., 2015).

Isua_meltwater_runoff_estimate

Minimum and maximum plausible supraglacial ice sheet catchments associated with the Isua site. Shading denotes mean annual meltwater runoff over the 2004 to 2013. Background image source is Landsat 8 (source: Arenson and Colgan, 2015).

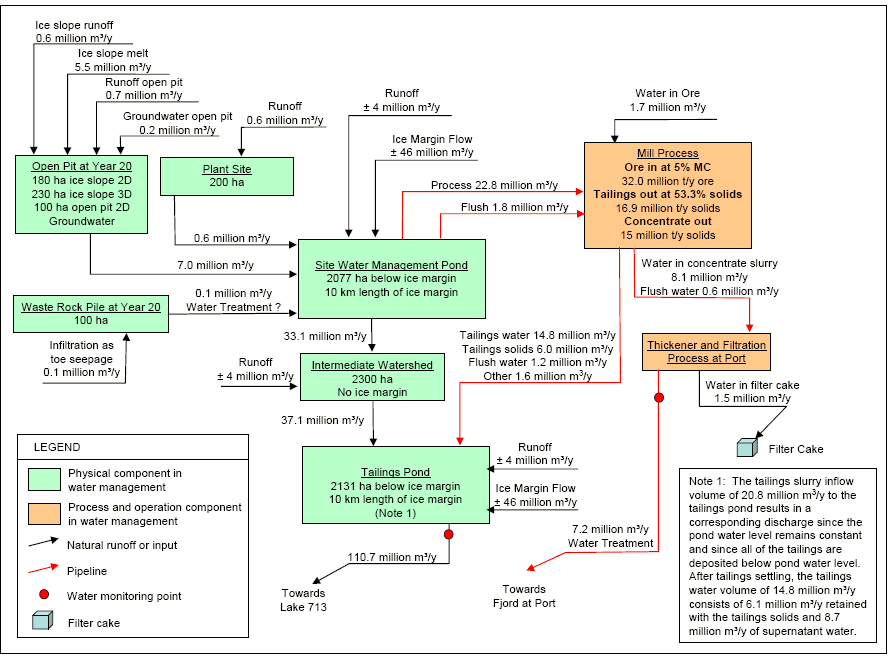
To place our estimate in context, London Mining Plc, the initial developer of the Isua site, presented a pre-feasibility study water balance in which ice sheet runoff into the pit was estimated as 7.8·106 m3/year (London Mining, 2011). Assuming a 60-day melt season, this is equivalent to an average site inflow of 1.3·108 L/day. Our estimate is therefore 22 times greater than the design estimate. There are many potential sources of uncertainty when assessing ice sheet runoff, including model uncertainty and climatic variability, but by far the biggest source of uncertainty is delineating the ice sheet catchment draining to a specific portion of the ice sheet margin. Regardless of whether 108 or 109 L/day of meltwater is flowing into the Isua site, it will certainly be a challenging operating environment, and will require some very adaptive engineering to minimize site contact water!

Isua_SNC_Budget

Proponent water budget for the Isua Mine (source: London Mining, 2011).

Isua_2011 173

Oblique aerial photograph looking west from the Greenland ice sheet across the Isua site in 2011. Deeply incised supraglacial meltwater channels are visible draining towards the margin. (source: Lukas Arenson)

References

Andersen et al., 2015. Basin-scale partitioning of Greenland ice sheet mass balance components (2007–2011). Earth and Planetary Science Letters 409: 89-95.

Arenson and Colgan. 2015. Water management challenges associated with mining projects in Greenland. Proceedings of Mine Water Solutions in Extreme Environments. 533-543.

London Mining PLC. 2011. Isua iron ore project: Isua 15 Mtpa scoping study report.

Tags: , , , , ,