BLOG

model

Q-Transect: A Hotspot of Greenland ice loss

Posted by William Colgan on June 19, 2018
Climate Change, New Research / No Comments

We are introducing a rich trove of ice-sheet surface mass balance measurements in an open-access study in the current issue of Journal of Geophysical Research1. The Qagssimiut Lobe is among the most southern ice lobes of the Greenland Ice Sheet. The Q-transect – which runs up the heart of the Qagssimiut Lobe – has been home to automatic weather stations recording ice and climate measurements since 2000. In this study, we have compiled sixteen years of annual surface mass balance measurements and also added three hard-fought years of winter snow accumulation measurements. These data – spanning 300 to 1150 m elevation – now form an exceedingly unique record of ice-sheet health.
Herm_1

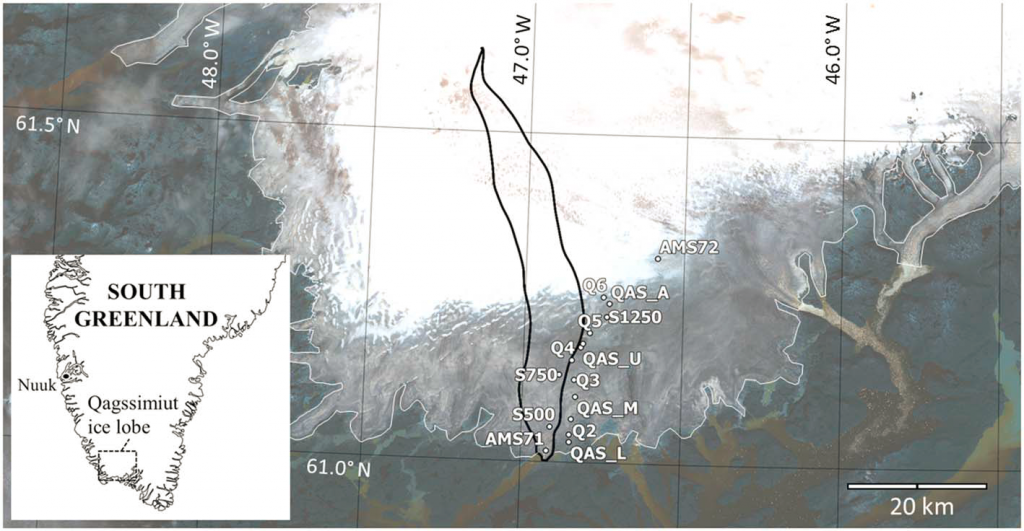
Figure 1. The Qagssimiut Lobe in South Greenland. Measurement locations are denoted with white dots. The Sermilik Glacier catchment is delineated with a black line. The ice-sheet margin is delineated with a white line. The background image was acquired by the ESA Sentinel-2 satellite on 28 August 2016 and clearly illustrates the bare ice area below equilibrium line altitude.

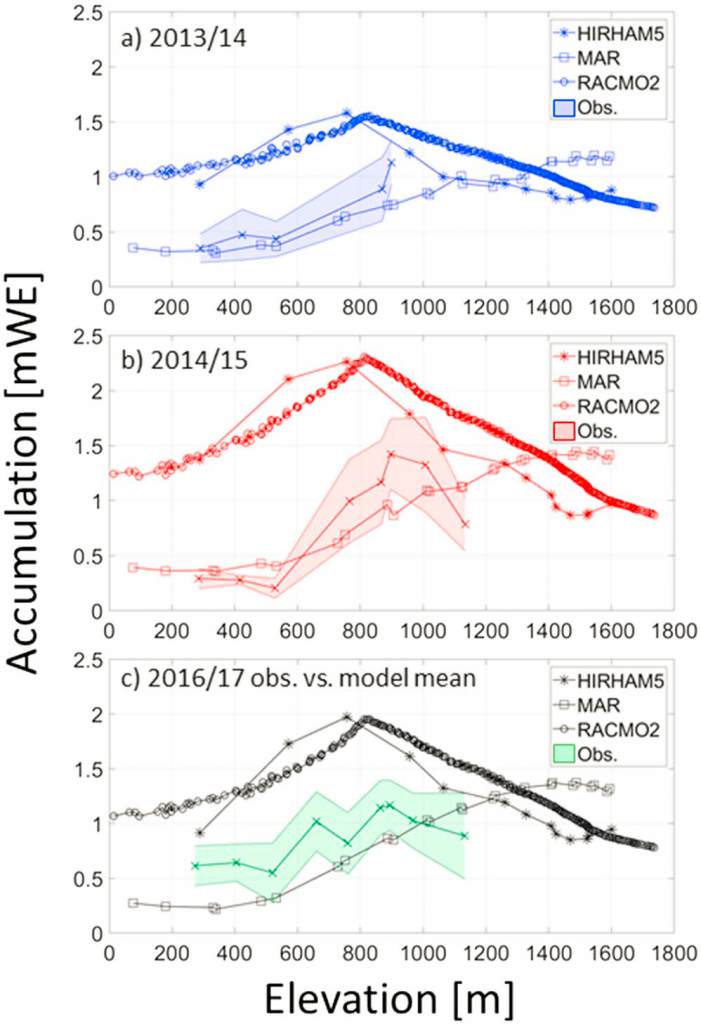
These comprehensive in situ measurements allowed us to evaluate the accuracy of the surface mass balance simulated by climate models. TO do this, we stacked our measurements against comparable simulations from three leading regional climate models (HIRHAM5, MAR and RACMO2). The climate models generally did well, but were never bang-on the measurements. One climate model consistently simulated more negative surface mass balances and lower equilibrium line altitudes than we measured. The other two model usually did the opposite, implying the ice sheet was healthier than in reality. These biases appear to stem from differences in simulated winter snow accumulation – which can vary by 200 % at low elevations – between models.
Herm_2

Figure 2. Elevation profiles of measured and simulated winter snow accumulation in (a) 2013/2014, (b) 2014/2015, and (c) 2016/2017. Shaded areas indicate uncertainty ranges. In (c), black lines illustrate the comparison of the model mean for 2000/2001 to 2015/2016 with the 2016/2017 observations.

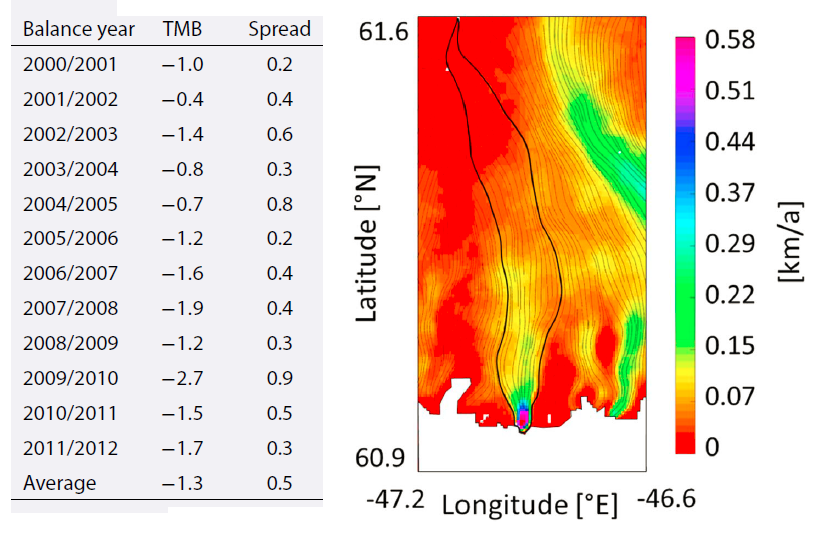
Combining our knowledge of surface mass balance over the Qagssimiut Lobe with independent observations of iceberg calving rate at Sermilik Glacier – the main tidewater draining Qagssimiut Lobe – allowed us to calculate a total mass balance. We found that the relatively small Sermilik Glacier catchment is now losing up to 2.7 Gt of ice per year. That is a rather astounding – 20 times greater than the ice sheet average – the Sermilik Glacier catchment represents only about 0.03 % of ice-sheet area but is contributing about 0.61 % of ice-sheet mass loss. Its extreme southern location clearly makes Sermilik Glacier a hotspot of ice-sheet mass loss. Its rate of ice loss is more characteristic of lower latitude Andean glaciers than the vast majority of Greenland.
HERM_3

Figure 3. Left: Estimated total mass balance of Sermilik Glacier catchment between 2001 and 2012 in Gt/yr (uncertainty denoted by spread). Right: The Sermilik Glacier catchment overlaid on an ice velocity map derived from the ESA Sentinel-1 satellite. Thin lines indicate adjacent ice flow lines.

We hope that this study will be useful to climate modelers, as they further improve the accuracy with which their models simulate ice-sheet surface mass balance. We also hope that highlighting the Q-transect as a hotspot for both ice loss and in situ data availability will help inform future measurement campaigns seeking to improve our understanding of the physical processes influencing surface mass balance. All measurements of surface mass balance and winter snow accumulation are freely available in the study’s online material.
1Hermann, M., J. Box, R. Fausto, W. Colgan, P. Langen, R. Mottram, J. Wuite, B. Noel, M. van den Broeke and D. van As. 2018. Application of PROMICE Q-transect in situ accumulation and ablation measurements (2000-2017) to constrain mass balance at the southern tip of the Greenland ice sheet. Journal of Geophysical Research. 123: 10.1029/2017JF004408.

Tags: , , , , , , ,

Glacier Crevasses: A Review

Posted by William Colgan on February 29, 2016
New Research / No Comments

We have a new review paper on glacier crevasses in the current issue of Reviews of Geophysics1. We survey sixty years of crevasse studies, from field observations to numerical modeling to remote sensing of crevasses, and also provide a synthesis of ten distinct mechanisms via which crevasses influence glacier mass balance.

Two years ago, our team embarked on what was supposed to be a brief review of crevasse science to help interpret maps of Greenland crevasse extent that we are generating from laser altimetry data as part of a NASA project entitled “Assessing Greenland Crevasse Extent and Characteristics Using Historical ICESat and Airborne Laser Altimetry Data”. The final review ended up containing 250 references and being 43 typeset pages in length. Evidently we found the crevasse life cycle contained more nuances than we had initially assumed! Here are some of the highlights that have shifted our paradigm:

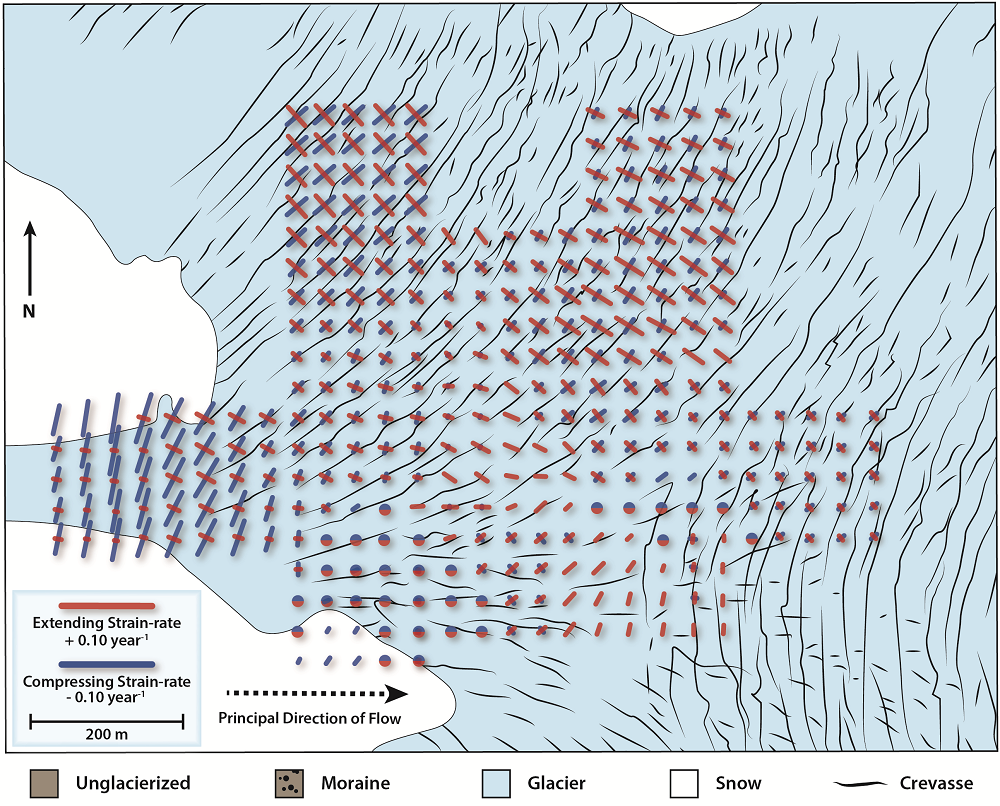
Field observations – Although crevasses are conventionally conceptualized to initiate at the surface and propagate downwards, we were surprised to find compelling evidence that at least some crevasses initiate at several metres depth, before propagating upwards to appear at the glacier surface. For example, observations that new crevasses can intersect relict crevasses at angles as low as 5 ° indicates that the stresses governing fracture are below the depth of relict crevasses (as relict crevasses do not serve as stress foci). This has implications for interpreting “buried” crevasses as relict or active.

Crevasse_Field_Sample

Figure 1 – Measured principal strain rates and crevasse locations observed circa 1995 at Worthington Glacier, USA2. The cross-cutting of relict crevasses by active crevasses indicates relative crevasse chronologies can exist at a single point on a glacier.

Numerical modeling – While crevasses have conventionally been assumed to form perpendicular to principal extending stresses on glaciers, we were intrigued to find strong model evidence that non-trivial crevasse curvature and rotation can result when there is substantial shearing (Mode III fracture) acting in addition to the more the common opening (Mode I fracture). The role of such mixed-mode fracture in shaping crevasse geometry has implications for interpreting curved / rotated crevasses as either deformed following opening or in equilibrium with local shear.

Crevasse_Modes

Figure 2 – Schematic illustrating the three modes of fracture: Mode I (opening), Mode II (sliding), and Mode III (tearing).

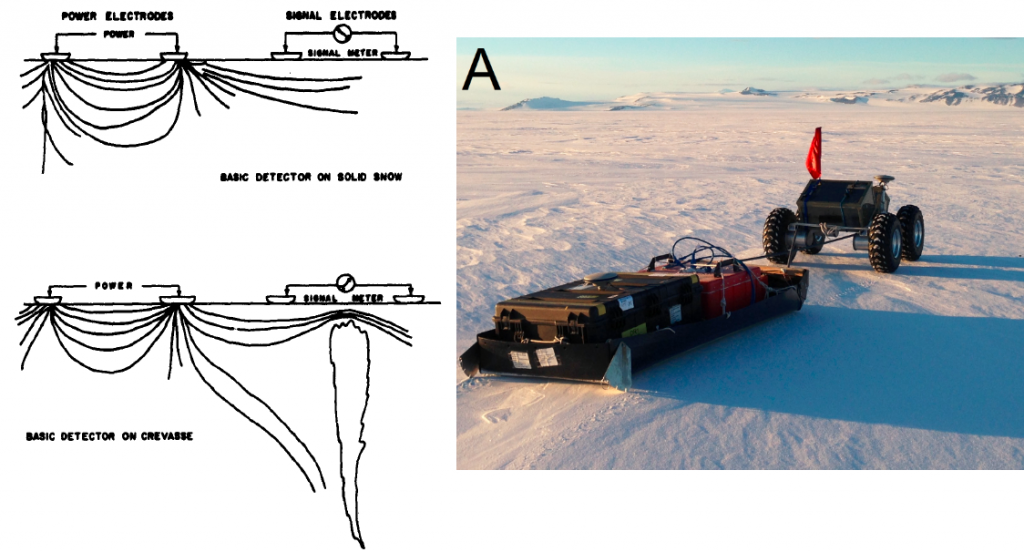
Remote Sensing – Remote sensing technologies for crevasse detection exhibited remarkable growth over the past 60 years. Real-time crevasse detection for traverse vehicles advanced from Cold War era rudimentary push-broom “dishpans”, which measured bulk electric current density of surrounding ice, to modern fully autonomous rovers capable of executing ground penetrating radar grids. In terms of satellite imagery, crevasses went from being manually delineated in the coarse resolution visible imagery that became available in the 1970s to now being automatically detected by feature tracking algorithms in higher resolution visible and synthetic aperture radar imagery.

CrevassePastPresent

Figure 3 – Left: Cold War era “dishpan” detection system that inferred crevasses from changes in bulk electric current density3. Right: An autonomous ground-penetrating radar unit (Yeti) being used to map near-surface buried crevasses at White Island, Antarctica. (Photo: Jim Lever)

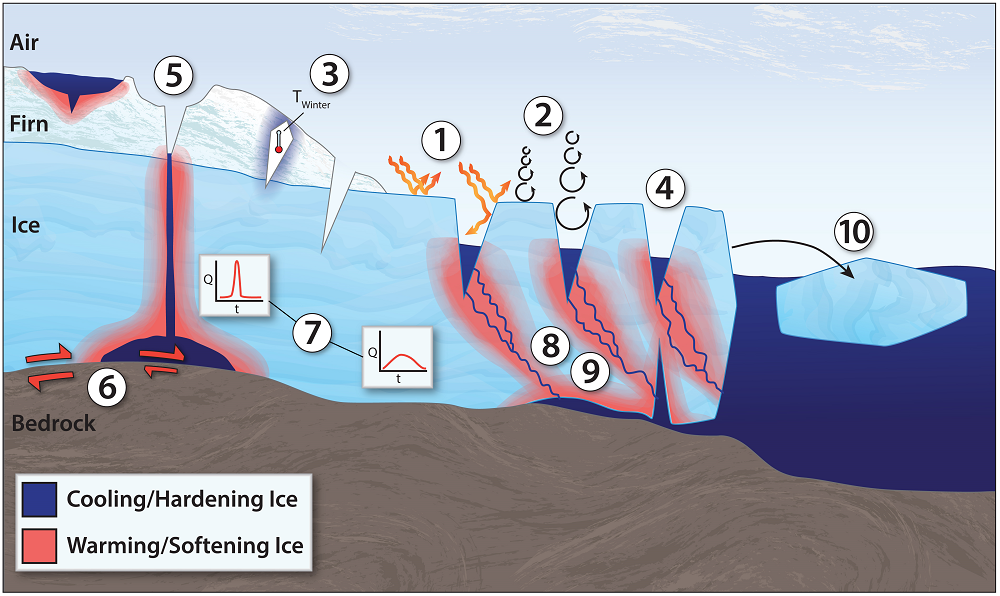
Mass Balance Implications – While many studies have described individual mechanisms by which crevasses can influence glacier mass balance, we wanted to provide an overview of all the possible mechanisms, and we were fortunate enough to have a graphic artist help us do it in a single schematic. The mass balance implications of crevasses contain several counter-intuitive nuances. For example, crevasses can enhance basal sliding in the accumulation area and suppress basal sliding in the ablation area. Given their myriad mass balance implications, however, crevasses may serve as both indicators and agents of changing glacier form and flow.

Crevasse_Summary

Figure 4 – Schematic overview of the various processes through which crevassed surfaces influence glacier mass balance relative to non-crevassed surfaces: (1) increased solar energy collection and enhanced surface ablation, (2) increased turbulent heat fluxes and enhanced surface ablation, (3) decreased buried crevasse air temperatures and suppressed ice deformation, (4) increased bulk glacier porosity and enhanced ablation area water retention, (5) increased supraglacial lake drainage and suppressed accumulation area water retention, (6) increased supraglacial lake drainage and enhanced ice deformation, (7) attenuated transmission of hydrologic variability (relative to moulins) and suppressed basal sliding velocities, (8) increased cryo-hydrologic warming of ice temperatures and enhanced ice deformation, (9) increased water content / hydraulic weakening and enhanced ice deformation, and (10) iceberg calving.

1Colgan, W., H. Rajaram, W. Abdalati, C. McCutchan, R. Mottram, M. S. Moussavi and S. Grigsby. 2016. Glacier crevasses: Observations, models, and mass balance implications. Reviews of Geophysics. 54: doi:10.1002/
2015RG000504.

2Harper, J., N. Humphrey and W. Pfeffer. 1998. Crevasse patterns and the strain-rate tensor: A high-resolution comparison. Journal of Glaciology. 44: 68–76.

3Mellor, M. 1963. Oversnow Transport. Cold Regions Science and Engineering. Monograph III-A4. 104 pages.

Tags: , , , , , , , , ,