BLOG

surface mass balance

Q-Transect: A Hotspot of Greenland ice loss

Posted by William Colgan on June 19, 2018
Climate Change, New Research / No Comments

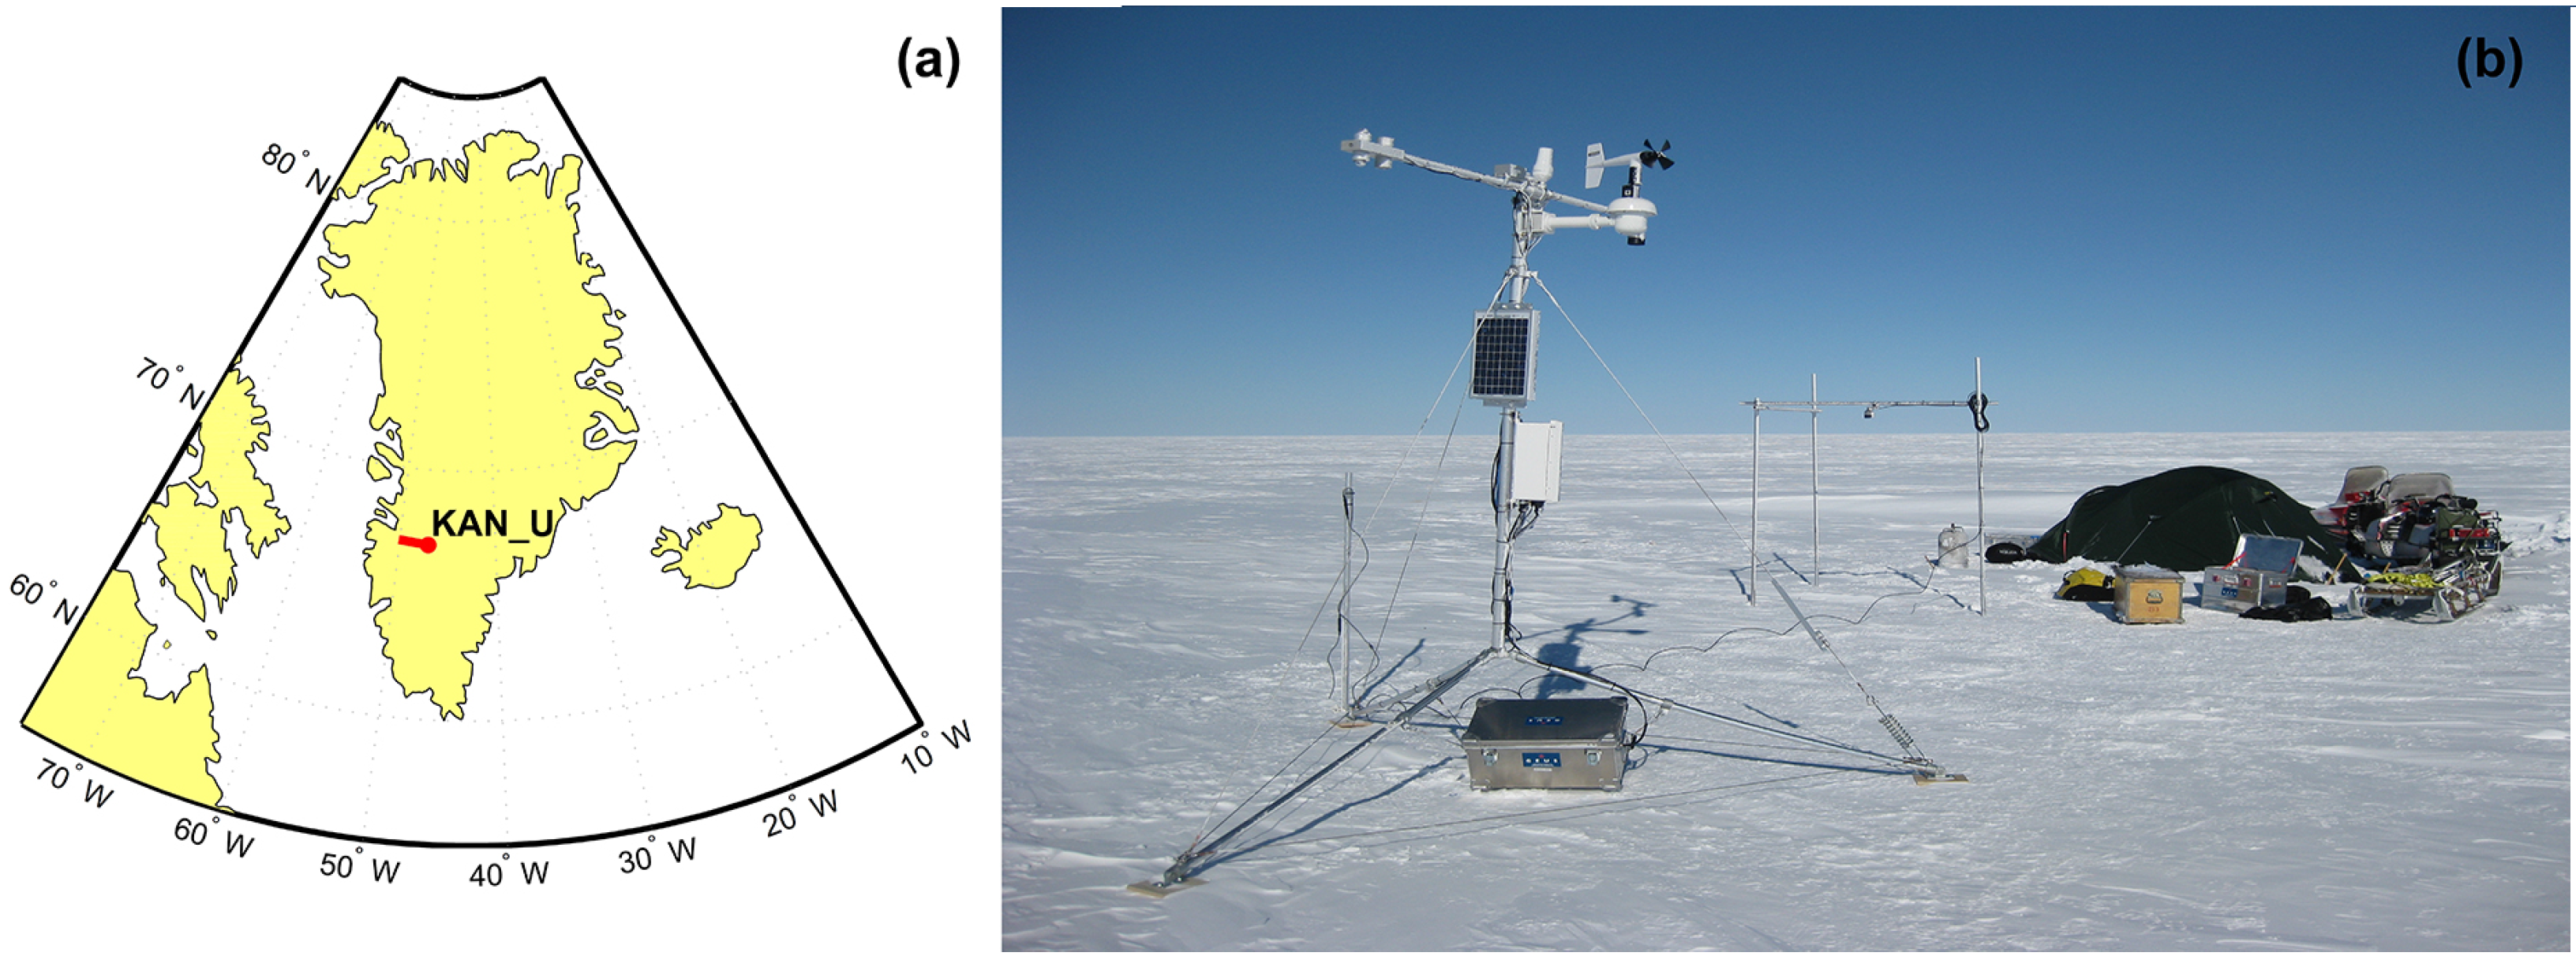
We are introducing a rich trove of ice-sheet surface mass balance measurements in an open-access study in the current issue of Journal of Geophysical Research1. The Qagssimiut Lobe is among the most southern ice lobes of the Greenland Ice Sheet. The Q-transect – which runs up the heart of the Qagssimiut Lobe – has been home to automatic weather stations recording ice and climate measurements since 2000. In this study, we have compiled sixteen years of annual surface mass balance measurements and also added three hard-fought years of winter snow accumulation measurements. These data – spanning 300 to 1150 m elevation – now form an exceedingly unique record of ice-sheet health.

Herm_1

Figure 1. The Qagssimiut Lobe in South Greenland. Measurement locations are denoted with white dots. The Sermilik Glacier catchment is delineated with a black line. The ice-sheet margin is delineated with a white line. The background image was acquired by the ESA Sentinel-2 satellite on 28 August 2016 and clearly illustrates the bare ice area below equilibrium line altitude.

These comprehensive in situ measurements allowed us to evaluate the accuracy of the surface mass balance simulated by climate models. TO do this, we stacked our measurements against comparable simulations from three leading regional climate models (HIRHAM5, MAR and RACMO2). The climate models generally did well, but were never bang-on the measurements. One climate model consistently simulated more negative surface mass balances and lower equilibrium line altitudes than we measured. The other two model usually did the opposite, implying the ice sheet was healthier than in reality. These biases appear to stem from differences in simulated winter snow accumulation – which can vary by 200 % at low elevations – between models.

Herm_2

Figure 2. Elevation profiles of measured and simulated winter snow accumulation in (a) 2013/2014, (b) 2014/2015, and (c) 2016/2017. Shaded areas indicate uncertainty ranges. In (c), black lines illustrate the comparison of the model mean for 2000/2001 to 2015/2016 with the 2016/2017 observations.

Combining our knowledge of surface mass balance over the Qagssimiut Lobe with independent observations of iceberg calving rate at Sermilik Glacier – the main tidewater draining Qagssimiut Lobe – allowed us to calculate a total mass balance. We found that the relatively small Sermilik Glacier catchment is now losing up to 2.7 Gt of ice per year. That is a rather astounding – 20 times greater than the ice sheet average – the Sermilik Glacier catchment represents only about 0.03 % of ice-sheet area but is contributing about 0.61 % of ice-sheet mass loss. Its extreme southern location clearly makes Sermilik Glacier a hotspot of ice-sheet mass loss. Its rate of ice loss is more characteristic of lower latitude Andean glaciers than the vast majority of Greenland.

HERM_3

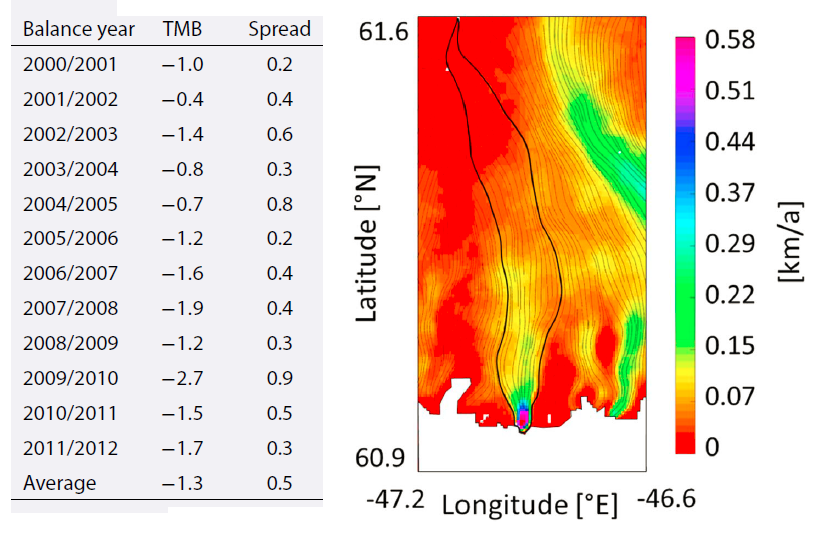
Figure 3. Left: Estimated total mass balance of Sermilik Glacier catchment between 2001 and 2012 in Gt/yr (uncertainty denoted by spread). Right: The Sermilik Glacier catchment overlaid on an ice velocity map derived from the ESA Sentinel-1 satellite. Thin lines indicate adjacent ice flow lines.

We hope that this study will be useful to climate modelers, as they further improve the accuracy with which their models simulate ice-sheet surface mass balance. We also hope that highlighting the Q-transect as a hotspot for both ice loss and in situ data availability will help inform future measurement campaigns seeking to improve our understanding of the physical processes influencing surface mass balance. All measurements of surface mass balance and winter snow accumulation are freely available in the study’s online material.

1Hermann, M., J. Box, R. Fausto, W. Colgan, P. Langen, R. Mottram, J. Wuite, B. Noel, M. van den Broeke and D. van As. 2018. Application of PROMICE Q-transect in situ accumulation and ablation measurements (2000-2017) to constrain mass balance at the southern tip of the Greenland ice sheet. Journal of Geophysical Research. 123: 10.1029/2017JF004408.

Tags: , , , , , , ,

Unprecedented Greenland Glaciology Database

Posted by William Colgan on September 23, 2016
Glaciology History, New Research / No Comments

The glaciological archive of the Geological Survey of Denmark and Greenland has accumulated both dust and documents over the years. This makes searching through this archive for glacier surface mass balance measurements a tedious task, as it means looking at every individual item. The occasional discovery of hand-written field notes describing a ten-year surface mass balance record can feel like finding a diamond in the rough.

Over the past five years, Horst Machguth led a team of 34 authors from 18 institutions in a near-exhaustive collection of historical surface mass balance observations from the Greenland ice sheet ablation area and peripheral glaciers. The database, which now contains 3000 measurements of surface mass balance, was published online this July in the Journal of Glaciology1. The measurements span 123 years, from the earliest surface mass balance measurements of Erich von Drygalski’s 1882-1883 Greenland Expedition of the Berlin Geographical Society, up to present-day automated weather station measurements.

temporal_overview_incl_map_v5_flat

Figure 1 – Overview of the data contained in the surface mass-balance database. (a) Temporal availability of data for each site and temporal resolution of the data. (b) Number of active measuring sites over time. (c) Number of active measuring points over time.

Approximately 60 % of the measurements were sourced from grey literature and unpublished documents scoured from the archives of the Geological Survey of Denmark and Greenland. Almost forgotten and inaccessible to scientists outside the Survey, they are essentially once again “new to science”. Some measurements, however, remain elusive, like those of Simpson’s 1952-1954 British North Greenland Expedition, and some other mid-20th Century expeditions.

Most measurements were made prior to the widespread adoption of handheld GPS devices. Making these data functional in today’s computer-based research environment turned out to be a major task, as it required translating numerous historical site diagrams into georeferenced latitude and longitude coordinate systems. Innovative solutions were adopted to translate ice surface elevation measurements made by the US Army Corps of Engineers (USACE) into surface mass balance values: cross-sectional profile of a supra-glacial access road could be translated into year-on-year changes in surface elevation equivalent to surface mass balance.

georef_nobles_v2_flat

Figure 2 – A US Army Corps of Engineering map of Nunatarssuaq Ice Ramp georeferenced with a modern digital elevation model.

Having brought together these temporally and spatially diverse measurements into a common digital database now offers an unprecedented opportunity to evaluate the accuracy of surface mass balance simulated by regional climate models. Even on their own, however, the data highlight the diverse rates of change in surface mass balance with elevation around the periphery of the Greenland ice sheet. The value of this data rescue project is perhaps highlighted by the fact that the database has already been used in at least five studies. The database provides a unique tool for understanding the climate sensitivity of Greenland glacier and ice sheet melt over the past century!

1MACHGUTH, H., THOMSEN, H.H., WEIDICK, A., AHLSTRØM, A.P., ABERMANN, J., ANDERSEN, M.L., ANDERSEN, S.B., BJØRK, A.A., BOX, J.E., BRAITHWAITE, R.J., BØGGILD, C.E., CITTERIO, M., CLEMENT, P., COLGAN, W., FAUSTO, R.S., GLEIE, K., GUBLER, S., HASHOLT, B., HYNEK, B., KNUDSEN, N.T., LARSEN, S.H., MERNILD, S.H., OERLEMANS, J., OERTER, H., OLESEN, O.B., SMEETS, C.J.P.P., STEFFEN, K., STOBER, M., SUGIYAMA, S., VAN AS, D., VAN DEN BROEKE, M.R. and VAN DE WAL, R.S.W. (2016) Greenland surface mass-balance observations from the ice-sheet ablation area and local glaciers. Journal of Glaciology, 1–27. doi: 10.1017/jog.2016.75.

Tags: , , , , , ,

Greenland Ice Sheet Melt-Albedo Feedback

Posted by William Colgan on December 01, 2015
Climate Change, New Research / No Comments

We have a new study in the current issue of The Cryosphere that looks at the surface energy budget at a site on the Greenland Ice Sheet, and particularly the energy available for meltwater production, over a five-year period spanning the 2010 and 2012 exceptional melt years1. While both the summers of 2010 and 2012 were exceptionally warm, only 2012 resulted in a negative mass balance. In fact, 2012 was the first year since records began that there was more meltwater runoff than snowfall at the site (KAN_U at 1840 m elevation in Southwest Greenland).

In the study we describe how the 2010 exceptional melt year appears to have preconditioned the near-surface layers of the ice sheet to dramatically strengthen the melt-albedo feedback in the subsequent 2012 exceptional melt year. Essentially, we suggest that near-surface ice lenses created by refreezing meltwater in the 2010 melt season made the ice sheet surface transition more readily from relatively high albedo light snow to relatively low albedo dark ice in the 2012 melt season. The substantially darker 2012 ice sheet surface absorbed more solar energy, and therefore caused more melt per ray of sunshine, than in 2010. We estimate that this melt-albedo feedback resulted in approximately 58 % more solar energy absorbed, and available for melt, in 2012 than in 2010.

While 2010 and 2012 were exceptional melt seasons in the context of the past thirty years, they are likely to have foreshadowed the upcoming thirty years. As Greenland climate is now rapidly warming, summer melt intensity no longer oscillates around its long term mean, and instead previously exceptional events are becoming normal. We therefore speculate that under persistent climate change, the firn at the KAN_U site will likely become saturated with refrozen ice lenses, which will enhance the melt-albedo feedback and perhaps even inhibit the downward percolation of meltwater. Ultimately, this will accelerate the transition of the contemporary lower accumulation area underlain by firn into an ablation area underlain by superimposed ice.

Maintaining the relatively sensitive automatic weather station needed to accurately measure surface energy fluxes in the relatively harsh ice sheet environment was no easy task. It took a number of scientists and funding agencies, which are listed in the acknowledgement section of the paper, to make this study possible. The KAN_U weather station continues to report real-time climate data via the Programme for Monitoring of the Greenland Ice Sheet (PROMICE) data portal: www.promice.dk.

2010_2012_Fluxes

Figure 1 – Monthly mean energy fluxes observed at KAN_U: shortwave (ES), longwave (EL), sensible heat (EH), evaporative (EE), geothermal (EG), precipitation (EP) and melt (EM). The melt flux was calculated as a residual.

KAN_U_location

Figure 2 – A: Location of Kangerlussuaq Upper Station (KAN_U) on the Greenland Ice Sheet. B: The PROMICE climate station deployed to measure surface energy budget.

1Charalampidis, C., D. van As, J. Box, M. van den Broeke, W. Colgan, S. Doyle, A. Hubbard, M. MacFerrin, H. Machguth and C. Smeets. 2015. Changing surface–atmosphere energy exchange and refreezing capacity of the lower accumulation area, West Greenland. The Cryosphere. 9: 2163-2181.

Tags: , , , , , , ,

Greenland’s “Recent Mass Loss” Underestimated?

Posted by William Colgan on March 09, 2015
Climate Change, Communicating Science, New Research / No Comments

There are a variety of methods used to estimate the present rate of mass loss from the Greenland ice sheet, including satellite altimetry, satellite gravimetry and input-output assessments. All of these methods generally agree that since 2005 the ice sheet has been losing c. 250 Gt/yr of mass (equivalent to 8000 tonnes of ice per second). Partitioning this mass loss into climatic surface balance (i.e. snowfall minus runoff) and ice dynamic (i.e. iceberg calving) contributions is a little more challenging. Partitioning recent mass loss into surface balance or ice dynamic components requires us to look at the changes in each of these terms since a period during which the ice sheet was approximately in equilibrium. Conventionally, the ice sheet is assumed to have been in equilibrium during the 1961-1990 so-called “reference period”.1

Figure_6_mass_balance_monitoring

The three main methods of measuring present-day ice sheet mass balance: (1) snowfall input minus iceberg output, (2) changes in elevation using satellite altimetry, and (3) changes in gravity using satellite gravimetry (from Alison et al., 2014)5.

Our recently published study in the Annals of Glaciology takes a hard look at the mass balance of the high elevation interior of the Greenland ice sheet during the reference period2. We difference the ice flowing out of a high elevation perimeter from the snow falling within it, and conclude that the ice sheet was likely gaining at least 20 Gt/yr of mass during the reference period. This implies that rather than ice sheet mass balance decreasing from c. 0 Gt/yr (or “equilibrium”) during reference period to c. -250 Gt/yr since 2005, it may have actually decreased from c. +20 Gt/yr of subtle mass gain during reference period to c. -250 Gt/yr since 2005. This interpretation would mean the “recent” (pre-1990 to post-2005) mass loss of the ice sheet is actually 7 % greater than might conventionally be assumed (270 vs. 250 Gt/yr). Seven percent more recent mass loss than conventionally assumed might not sound like much, but it becomes important when we try to partition mass loss in surface balance or ice dynamics components.

reference_period

Illustration of how a subtle mass gain during reference period (1961-1990) , when the Greenland ice sheet is conventionally assumed to have been in approximate equilibrium, can influence the magnitude of “recent mass loss” used to partition surface balance and ice dynamics components of mass loss.

We also assessed whether surface balance or ice dynamics were responsible for subtle reference period mass gain. We concluded it was more likely long term ice dynamics, resulting from the downward advection through the ice sheet of the transition between relatively soft Wisconsin ice (deposited > 10.8 KaBP) and relatively hard Holocene ice (deposited < 10.8 KaBP). In 1985, Niels Reeh proposed that subtly increasing effective ice viscosity was resulting in cm-scale ice sheet thickening3. Increased iceberg calving, or enhanced ice dynamics, are conventionally assumed to be responsible for c. 100 Gt/yr of recent mass loss4. Since we conclude ice dynamics were likely responsible for subtle reference period mass gain, we are implying that mass loss due to ice dynamics may actually be c. 20 Gt/yr greater than conventionally assumed, or c. 120 Gt/yr rather than c. 100 Gt/yr since 2005. Without invoking any departures from the conventional view of changes in surface balance since reference period, this infers 20 % more mass loss due to ice dynamics since reference period. This becomes important if diagnostic ice sheet model simulations are calibrated to underestimated recent ice dynamic mass loss, which may subsequently bias prognostic model simulations to similarly underestimate future ice dynamic mass loss.

Wisconsin_Tiff

An ice sheet composed of relatively hard Holocene ice is theoretically c. 15 % thicker than one composed of relative soft Wisconsin ice. Today’s ongoing transition from Wisconsin to Holocene ice within the Greenland ice sheet should theoretically result in cm-scale transient thickening (after Reeh, 1985).

Pondering how a millennial-scale shift in ice dynamics may be responsible for subtle mass gain during the 1961-1990 period, and how that ultimately influences our understanding of present-day mass loss partition, is definitely a rather nuanced topic. I am guessing there are not many non-scientists still reading at this point. Spread over the high elevation ice sheet interior, a 20 Gt/yr mass gain is equivalent to a thickening rate of just 2 cm/yr, which is within the uncertainty of virtually all mass balance observation methods, including in situ point measurements. I suppose the thrust of our study is to be receptive to the idea that millennial scale ice dynamics may be contributing to a subtle ice sheet thickening that underlies both past and present ice sheet mass balance, and to appreciate the non-trivial uncertainty in partitioning recent mass loss into surface balance and ice dynamic components that stems from the particular reference period mass balance assumption that is invoked.

1Van den Broeke, M., J. Bamber, J. Ettema, E. Rignot, E. Schrama, W. van de Berg, E. van Meijgaard, I. Velicogna and B. Wouters. 2009. Partitioning Recent Greenland Mass Loss. Science. 326: 984-986.

2Colgan, W., J. Box, M. Andersen, X. Fettweis, B. Csatho, R. Fausto, D. van As and J. Wahr. 2015. Greenland high-elevation mass balance: inference and implication of reference period (1961-90) imbalance. Annals of Glaciology. 56: doi:10.3189/2015AoG70A967.

3Reeh, N. 1985. Was the Greenland ice sheet thinner in the late Wisconsinan than now?
Nature. 317: 797-799.

4Enderlin, E., I. Howat, S. Jeong, M. Noh, J. van Angelen and M. van den Broeke. 2014. An improved mass budget for the Greenland ice sheet. Geophysical Research Letters. 41: doi:10.1002/2013GL059010.

5Alison, I., W. Colgan, M. King and F. Paul. 2014. Ice Sheets, Glaciers, and Sea Level Rise. Snow and Ice-Related Hazards, Risks and Disasters. W. Haeberli and C. Whiteman. Elsevier. 713-747.

Tags: , , , , , , , ,

Greenland data rescue: An appeal

Posted by William Colgan on November 24, 2014
Communicating Science, Glaciology History, New Research / No Comments

As described in this month’s newsletter No 7, the Programme for Monitoring of the Greenland Ice Sheet (PROMICE) is nearing completion of its comprehensive database of surface mass budget observations from the Greenland ice sheet melt area and peripheral glaciers. We now have just over 2400 unique observations spanning from the 1938 Freja Glacier expedition to the present. Approximately half these observations have never been published. These historic measurements were fragmented across studies, most of which were pre-digital or unpublished, effectively making this highly valuable data inaccessible to the global research community. Despite our best efforts, however, we are still missing data from a handful of known expeditions. For example, does someone you know perhaps have a copy of Alfred Wegener’s 1930 Qaamarujuk Glacier observations? There is a chance we might even be unaware of some expeditions, especially recent private sector prospecting work. Please get in touch with Horst Machguth (homac@byg.dtu.dk) of the www.promice.dk team if you can help us out with this community data assimilation project!

Colgan, W., H. Machguth and A. Ahlstrom. 2014. Data Rescue: Greenland Surface Mass Budget Database. PROMICE newsletter No 7. Ed. S. Andersen and H. Pedersen.

database_map

Map of the location, with temporal description, of the Greenland ice sheet melt area and local glacier surface mass budget observations presently contained in the database. The grey sites are the missing data (from a manuscript in preparation).

Tags: , , , , ,