BLOG

Monthly Archives: July 2015

Vanishing Canada: Group of Seven Landscapes Under Climate Change

Posted by William Colgan on July 31, 2015
Climate Change, Communicating Science / 3 Comments

In collaboration with Virginia Eichhorn of the Tom Thomson Art Gallery, I am hoping to get a very interdisciplinary arts and sciences project underway that looks at the impact of recent and projected climate change on the Canadian landscapes painted by the Group of Seven. The exceptionally vivid expressionist landscape scenes painted by the Group of Seven between 1920 and 1935 have become Canadian cultural icons. The temperature and precipitation trends associated with climate change, however, are changing these landscapes, most visibly through changes in vegetation, snow and glacier extent, lake or sea ice extent, and flood or drought frequency (Figure 1). We intend to reframe Group of Seven paintings as unique time capsules of a vanishing Canada, rather than portraits of an intransient Canada.

Mount_Robson_mockup

Figure 1 – Highly visible landscape change at Mount Robson due to air temperature change. Red shading denotes glacier area change since Lawren Harris originally painted this scene c. 1930.

To do this, we are seeking to dispatch contemporary emerging artists across Canada, to landscapes featured in Group of Seven works, to re-paint impressions of these landscapes under one of three IPCC Representative Concentration Pathways (RCPs). These RCPS, ranging from RCP 4.5 to RCP 8.5, essentially range from “optimistic” to “pessimistic” CO2emissions reductions scenarios. For example, RCP 4.5 simulates 4.5 W/m2 increased radiative forcing in year 2100 relative to year 1850, while RCP 8.5 simulates 8.5 W/m2, or almost twice as much, anomalous radiative forcing associated with well-mixed greenhouse gases from anthropogenic sources.

Mock_up2

Figure 2 – Envisioning a landscape in 2100 under three IPCC scenarios that vary from the “optimism” of RCP 4.5 to the “pessimism” of RCP 8.5. Byng Inlet was originally painted by Tom Thomson c. 1920.

We are ultimately aiming for a cross-disciplinary arts and sciences exhibition that will place specific Group of Seven landscapes, and more broadly Canada’s landscape, in the context of ongoing climate change in a highly visual fashion. Inspired by ArtTracks150, we are hoping that Canada’s 150th birthday (July 2017) may provide a natural window of increased public awareness of centurial time-scales, during which we might briefly focus public attention on the multi-generational implications of climate change on the Canadian landscape. Virginia and I welcome you to contact us for more information on, and ways to get involved with, this project.

Tags: , , , , ,

Artificial Glacier Surges at Kumtor Mine

Posted by William Colgan on July 27, 2015
Applied Glaciology, New Research / No Comments

Jamieson and colleagues published a very neat investigation of the applied glaciology challenges at Kumtor Mine, Kyrgyzstan, this week in the AGU Journal of Geophysical Research: Earth Surface (open access here). The recovery of subglacial gold deposits at Kumtor Mine has necessitated the excavation of an open ice pit into the Lysii and Davidov Glaciers. In addition to excavating glacier overburden, a major geotechnical challenge at Kumtor Mine has been managing the flow of both glaciers. In their study, Jamieson et al. (2015) use a comprehensive set of high resolution satellite images to document recent artificial surges induced in both these glaciers in response to mining activities. Photos released by Radio Free Europe in 2013 suggest that these artificial surges quite adversely impacted mining operations (Figure 1).

Kumtor_glacier_damage

Figure 1 – Infrastructure damage resulting from what is now a confirmed glacier advance at the Kumtor Mine in Kyrgyzstan (originally discussed in this earlier post)

The dumping of waste rock on both glaciers, in which waste rock piles reached up to 180 m thick, substantially increased the driving stress of the ice beneath. Given that ice deformation is related to driving stress to an exponent of three, and potentially higher exponents at higher driving stresses, this resulted in a significant increase in ice velocity. Jamieson et al. (2015) estimate that surface velocities of the Davidov Glacier increased from a few meters per year to several hundred meters per year within a decade. During this time, the Lysii and Davidov Glaciers advanced by 1.2 and 3.2 km, respectively, with Davidov Glacier terminus advance reaching 350 meters per year in c. 2012 (Figure “7”).

Jamieson1

This study is probably the most textbook-comprehensive documentation of a human-induced artificial glacier surge to date, and will provide a great resource for my students to debate the sometimes fine line between geotechnical misstep and natural hazard!

Reference

(Jamieson, S., M. Ewertowski and D. Evans. 2015. Rapid advance of two mountain glaciers in response to mine-related debris loading. Journal of Geophysical Research: Earth Surface. 120: doi:10.1002/2015JF003504.

Tags: , , , , ,

Greenland Ice Sheet “Thermal-Viscous Collapse”

Posted by William Colgan on July 17, 2015
Climate Change, New Research / No Comments

We have a new study in the AGU open access journal Earth’s Future this month, which introduces the notion of thermal-viscous collapse of the Greenland ice sheet1. While people tend to think of ice as a solid, it is actually a non-Newtonian fluid, because it deforms and flows over longer time-scales. Of the many strange material properties of ice, the non-linear temperature dependence of its viscosity is especially notable; ice at 0 °C deforms almost ten times more than ice at -10 °C at the same stress. This temperature-dependent viscosity makes ice flow very sensitive to ice temperature. We know that the extra meltwater now being produced at the surface of the Greenland ice sheet, relative to 50 or 100 years ago, contains tremendous latent heat energy. So, in the study, we set out to see if the latent heat in future extra meltwater might have a significant impact on future ice sheet form and flow.

We first developed a conceptual model of what we called “thermal-viscous collapse”, which we define as the enhanced ice flow resulting from warming ice temperatures and subsequently softer ice viscosities. We decided there were three key processes necessary for initiating a thermal-viscous collapse: (1) sufficient energy available in future meltwater runoff, (2) routing of that extra meltwater to the ice-bed interface, and (3) efficient transfer of latent energy from meltwater to the ice. Drawing on previous model projections and observational process studies, and admittedly an injection of explicit speculation, we concluded that it is plausible to warm the deepest 15 % of the Greenland ice sheet, where the majority of deformation occurs, from characteristic Holocene temperatures to the melting-point in the next four centuries.

Figure_2

Figure 1 – Three key elements of thermal-viscous Greenland ice sheet collapse: (1) Sufficient energy available in projected Greenland meltwater runoff, (2) Routing of a fraction of meltwater to the interior ice-bed interface, and (3) Efficient energy transfer from meltwater to ice. This cross-sectional profile reflects mean observed Greenland ice surface and bedrock elevations between 74.1 and 76.4°N. Dashed lines illustrate stylized marine and land glacier termini.

We then used a simple (first-order Navier-Stokes) model of ice flow to simulate the effect of this warming and softening on the ice sheet over the next five centuries. We used a Monte Carlo approach, whereby we ran fifty simulations in which multiple key parameters were varied within their associated uncertainty. As may be expected, warming the deepest 15 % of the ice sheet by 8.8 °C, from characteristic Holocene temperatures to the melting-point, had a significant influence on ice sheet form and flow. Due to softer ice viscosities, the mean ice sheet surface velocity increased three fold, from 43 ± 4 m/yr to 126 ± 17 m/yr, resulting in an ice dynamic drawdown of the ice sheet, causing a 5 ± 2 % ice sheet volume reduction within 500 years. This is equivalent to a global mean sea-level rise contribution of 33 ± 18 cm (or just over one US foot). Of course, the vast majority of the sea level rise associated with thermal-viscous collapse would occur over subsequent millennia.

Figure_11

Figure 2 – Probability density time series of ensemble spread of 50 simulations in prescribed ice temperature (a), mean surface ice velocity (b), and ice volume (c), over a 200-year spin-up to transient equilibrium, and the subsequent 500-year combined transient forcing and spin-down period.

Perhaps a caveat or two: Just like simulating a marine instability induced collapse of the West Antarctic ice sheet, our simulation of a thermal-viscous collapse of the Greenland ice sheet is an entirely hypothetical end-member scenario. It is admittedly difficult to interpret end-member assessments when their probability of occurrence is unknown. In our case, we did not attempt to constrain the probability of a thermal-viscous collapse of the Greenland ice sheet, we merely demonstrated that initiating a thermal-viscous collapse appears plausible within four centuries, and assessed the associated sea-level rise contribution. Additionally, it may be debatable whether the combination of crevasses and reverse drainage can indeed route meltwater throughout the ice sheet interior, but I suppose that is a debate worth having!

Reference

1Colgan, W., A. Sommers, H. Rajaram, W. Abdalati, and J. Frahm. 2015. Considering thermal-viscous collapse of the Greenland ice sheet. Earth’s Future. 3. doi:10.1002/2015EF000301.

Tags: , , , , , , , ,

Hybrid Gravimetry and Altimetry Mass Balance

Posted by William Colgan on July 07, 2015
Communicating Science, New Research, Sea Level Rise / No Comments

We have a new study in this month’s Remote Sensing of Environment, which examines satellite-derived glacier mass balance in Greenland and the Canadian Arctic1. Satellites are generally used to assess glacier mass balance through changes in volume (via satellite altimetry) or changes in mass (via satellite gravimetry). While satellite altimetry observes volume changes at relatively high spatial resolution, it necessitates the forward modeling of firn processes to convert volume changes into mass changes. Conversely, the cryosphere-attributed mass changes observed by satellite gravimetry, while very accurate in absolute terms, have relatively low spatial resolution. In this study, we sought to combine the complementary strengths of both approaches. Using an iterative inversion process that was essentially sequential guess-and-check with a supercomputer, we refined gravimetry-derived observations of cryosphere-attributed mass changes to the relatively high spatial resolution of altimetry-derived volume changes. This gave us a 26 km spatial resolution mass balance field across Greenland and the Canadian Arctic that was simultaneously consistent with: (1) glacier and ice-sheet extent derived from optical imagery, (2) cryospheric-attributed mass trends derived from gravimetry, and (3) ice surface elevation changes derived from altimetry. We have made digital versions of this product available in the supplementary material associated with the publication.

Figure_1

Figure 1 – Observational data inputs to our inversion algorithm. A: Cryosphere-attributed mass changes observed by gravimetry. B: Land ice extent observed by optical imagery. C: Ice surface elevation changes observed by altimetry.

To make sure our inferred mass balance field was reasonable, we evaluated it against all in situ point mass balance observations we could find. Statistically, the validation was great, yielding an RMSE of 15 cm/a between the inversion product and in situ measurements. Practically, however, this apparent agreement largely stems from the fact that we could only find forty in situ point mass balance observations against which to compare. Evaluating our area-aggregated sector-scale mass balance estimates against all previously published sector-scale estimates provides a more meaningful validation. This suggests the magnitude and spatial distribution of inferred mass balance is reasonable, but highlights that the community needs more in situ point observations of mass balance, especially from peripheral glaciers and regions of high dynamic drawdown in Greenland. (For the glaciology hardcores I will note that “mass balance” is distinct from “surface mass balance”, in that the former measurement also includes the ice dynamic portion of mass change.)

Figure_11_corrected

Figure 2 – A comparison of similar sector scale mass balance estimates and associated uncertainties across Greenland and the Canadian Arctic. Dashed lines denote estimates that pertain to the Greenland ice sheet proper (i.e. exclusive of peripheral glaciers). Jacob et al. (2012) estimates pertain to Canada, while Sasgen et al. (2012) estimates pertain to Greenland.

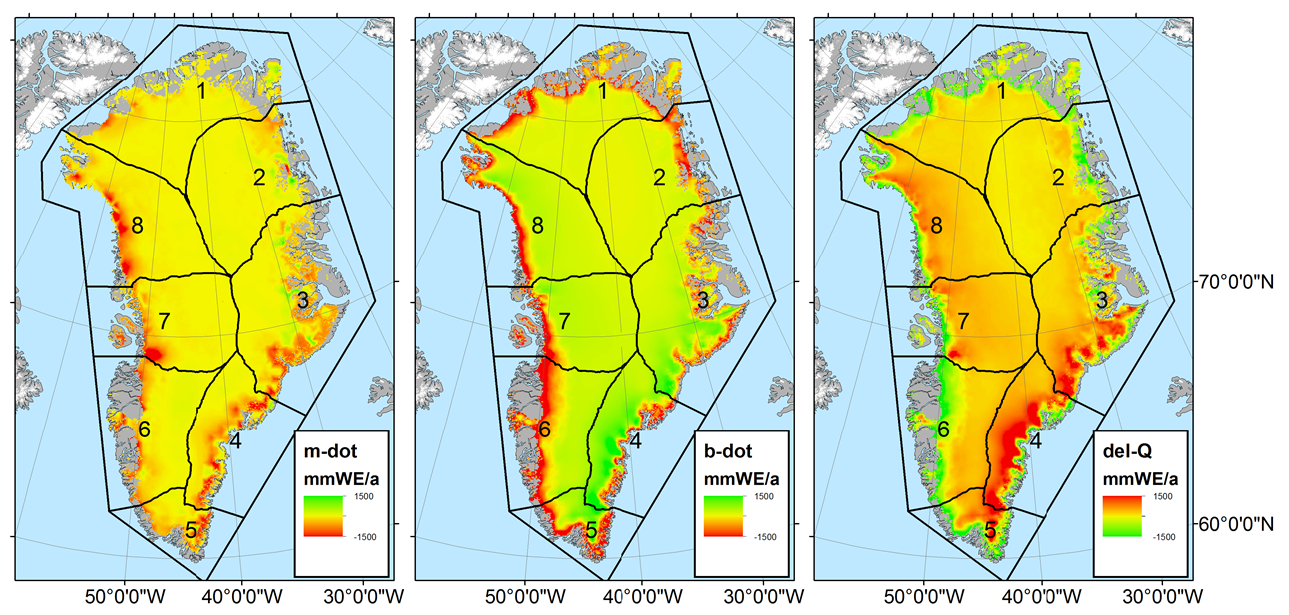
This new inversion mass balance product, which we are calling “HIGA” (Hybrid glacier Inventory, Gravimetry and Altimetry), suggests that between 2003 to 2009 Greenland lost 292 ± 78 Gt/yr of ice and the Canadian Arctic lost  42 ± 11 Gt/yr of ice. While the majority of Greenland’s ice loss was associated with the ice sheet proper (212 ± 67 Gt/yr), peripheral glaciers and ice caps, which comprise < 5 % of Greenland’s ice-covered area, produced ~ 15 % of Greenland mass loss (38 ± 11 Gt/yr). A good reminder that ice loss from “Greenland” is not synonymous with ice loss from the “Greenland ice sheet”. Differencing our tri-constrained mass balance product from a simulated surface mass balance field allowed us to assess the ice dynamic component of mass balance (technically termed the “horizontal divergence of ice flux”). This residual ice dynamic field infers flux divergence (or submergent ice flow) in the ice sheet accumulation area and at tidewater margins, and flux convergence (or emergent ice flow) in land-terminating ablation areas. This is consistent with continuum mechanics theory, and really highlights the difference in ice dynamics between the ice sheet’s east and west margins.

Figure_13

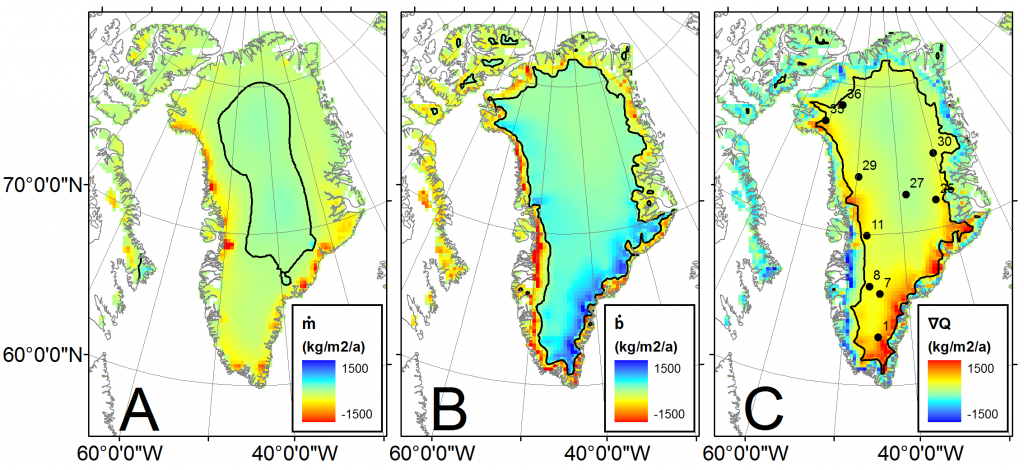
Figure 3 – Spatially partitioning the glacier continuity equation in surface and ice dynamic components. A: Transient glacier and ice sheet mass balance. B: Simulated surface mass balance. C: Residual ice dynamic (or horizontal divergence of ice flux) term. The ∇Q color scale is reversed to maintain blue shading for mass gain and red shading for mass loss in all subplots. Color scales saturate at minimum and maximum values. Black contours denote zero.

As with some scientific publications, this one has a bit of a backstory. In this case, we submitted a preliminary version of the study to The Cryosphere in December 2013. After undergoing three rounds of review at The Cryosphere, the first one of which is archived in perpetuity here, it was rejected, primarily for insufficient treatment of the uncertainty associated with firn compaction. Coincidentally, on the same day I received The Cryosphere rejection letter, I received a letter from the European Space Agency (ESA) granting funding for a follow-up study. A mixed day on email indeed! After substantial retooling, including a discussion section dedicated to firn compaction and the most conservative error bounds conceivable, we were happy to see this GRACE-ICESat study funded by NASA and the Danish Council for Independent Research appear in Remote Sensing of Environment. The editors at both journals, however, were very helpful in moving us forward. Our ESA-funded GRACE-CryoSat product development is now ongoing, but a sneak peek is below.

ESA_partition

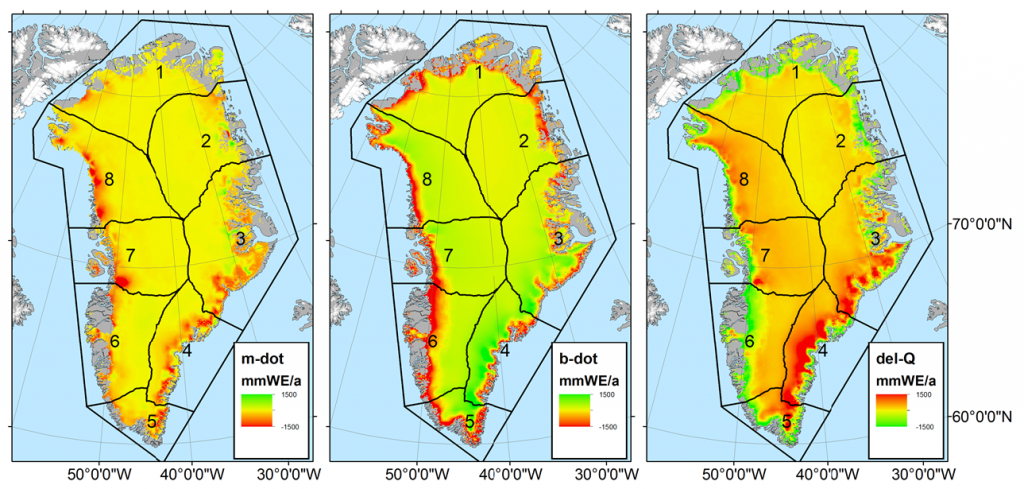
Figure 4 – Same as Figure 3, except using a 5 km resolution GRACE-CryoSat inversion product instead of a 26 km resolution GRACE-ICESat inversion product. Colorbars are different in shading, but identical in magnitude.

Reference

1W. Colgan, W. Abdalati, M. Citterio, B. Csatho, X. Fettweis, S. Luthcke, G. Moholdt, S. Simonsen, M. Stober. 2015. Hybrid glacier Inventory, Gravimetry and Altimetry (HIGA) mass balance product for Greenland and the Canadian Arctic. Remote Sensing of Environment. 168: 24-39.

Tags: , , , , , ,